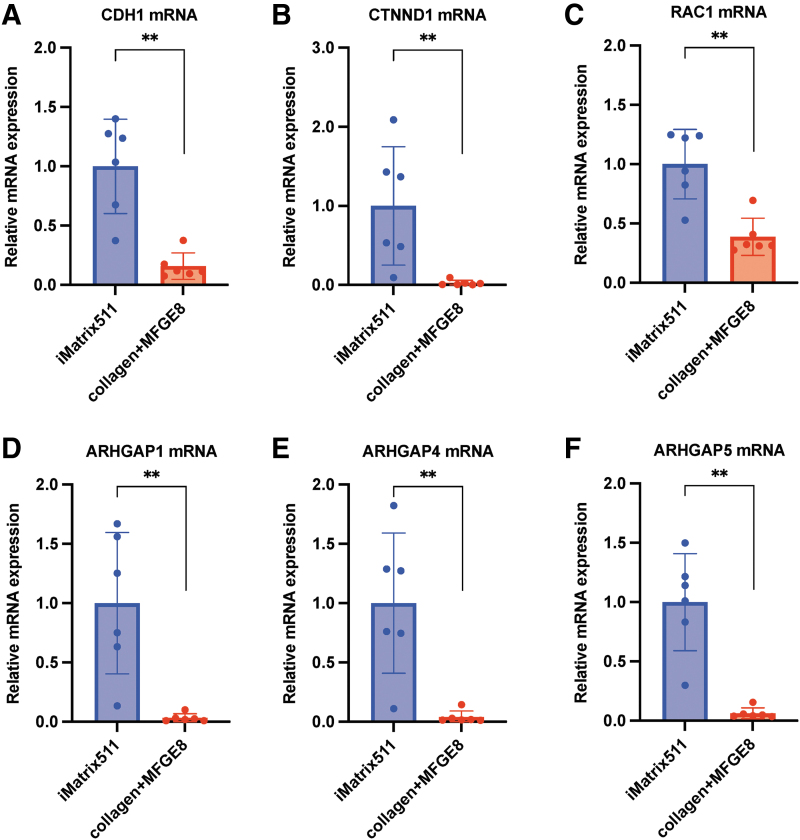
FIG. 5.
mRNA expression analysis. (A) CDH1, (B) CTNND1, (C) RAC1, (D) ARHGAP1, (E) ARHGAP4, and (F) ARHGAP5 mRNA expression from hiPSC on iMatrix511 or collagen+MFGE8 was measured using real-time PCR. Values indicate the relative value obtained by converting the calculated value of iMatrix511 to 1 (n = 6). The data are presented as the mean ± SD: standard error. *P < 0.05, **P < 0.01.

