FIG. 8.
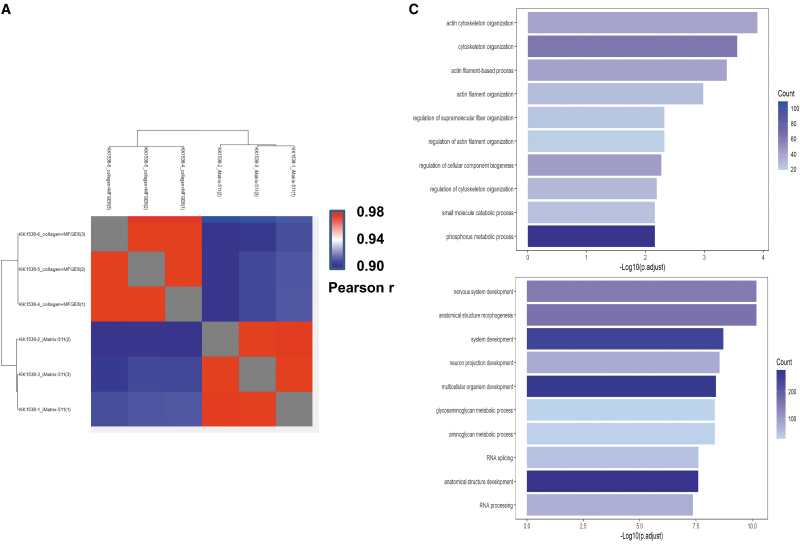
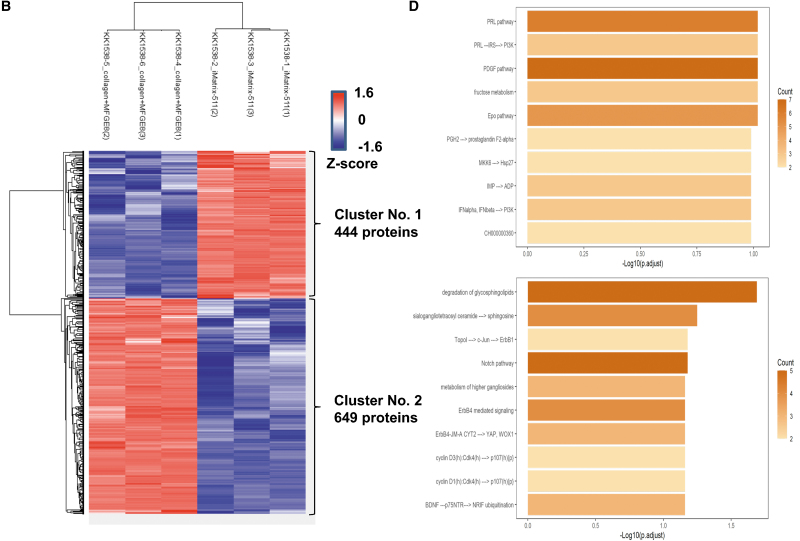
Standard DIA proteome analysis findings. (A) The correlation coefficient (Pearson r) between samples is calculated from the overall quantitative values, and a heatmap is created to cluster and present the differences between samples. (B) Proteins with P < 0.05 (two groups: T-test) were selected if the mean value of each group varied more than twofold, and the difference between groups were P < 0.05 (two groups: T-test). Each quantitative value was converted to a Z-score, and a heatmap was created. (C) The results of the GO analysis of increased protein groups in cluster 1 (upper panel) or increased protein groups in cluster 2 (lower panel), showing the bar graph of the top 10 in the result of Biological Process is shown. (D) The results of the Pathway analysis in the increased protein groups in cluster 1 (upper panel) or increased protein groups in cluster 2 (lower panel), showing the bar graph of the top 10 in the result of Pathway analysis is shown. DIA, data-independent acquisition.


