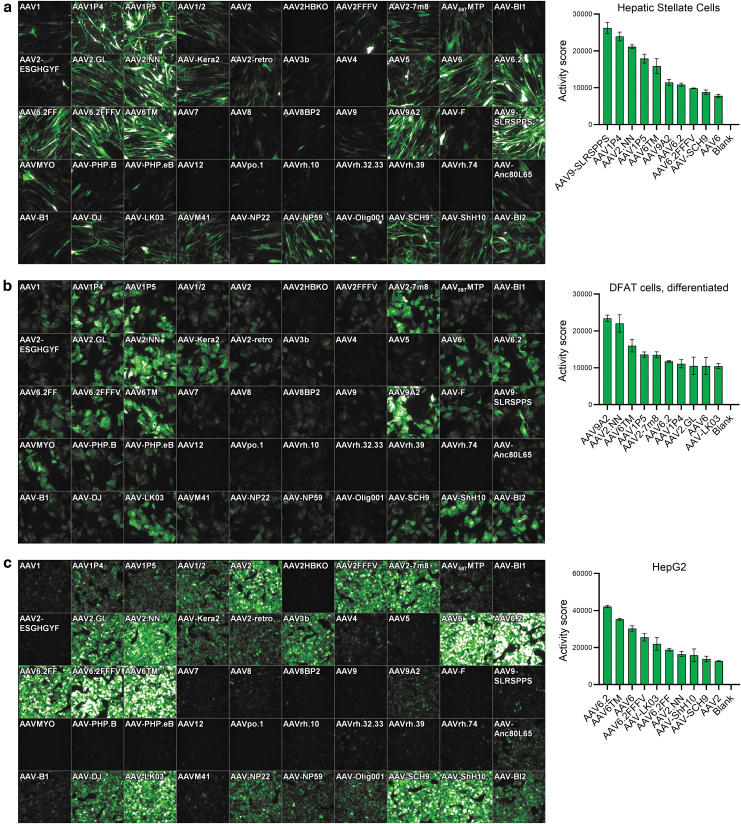
Figure 2.
Transduction efficiency on hepatic stellate, differentiated DFAT cells, and HepG2 cells. (a) Primary human hepatic stellate cells (11,000 cells/well), (b) differentiated primary human DFAT cells (15,000 cells/well), and (c) HepG2 cells (50,000 cells/well) were seeded in 96-well plates. Twenty-four hours later, cells were transduced with 2 × 10⁹ vg per AAV variant. Three days later, images were taken by high-content fluorescence microscopy, and GFP-positive cells were quantified by flow cytometry (hep. stellate cells) or semiautomated image analysis (diff. DFAT, HepG2). A ranking of the top performing AAV variants based on the Activity score (%GFP-positive cells × MFI/100) is shown next to each microscopic image. n = 2 (diff. DFAT) and n = 3 (hep. stellate cells, HepG2) replicate plates, respectively. Mean ± SD. DFAT cells, dedifferentiated fat cells; MFI, mean fluorescence intensity; SD, standard deviation.

