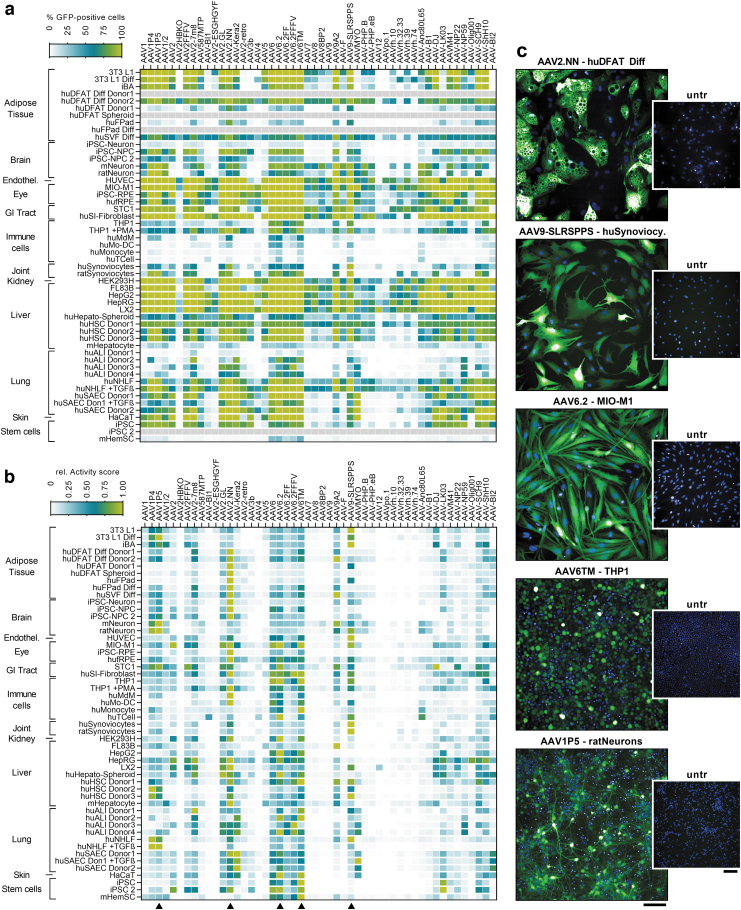
Figure 5.
Overview of transduction data and selected application examples for the five AAV core panel variants. (a) Heatmap showing the percentage of GFP-positive cells for all 50 AAV variants and transduced cell types, categorized by tissue origin. All cell types and culture methods are described in detail in the Supplementary Data. (b) Activity score (% GFP-positive cells × mean fluorescence intensity/100), normalized to the most efficient capsid variant per cell type. The most efficient AAV variant therefore shows a value of 1. Arrowheads mark the five capsids selected for the AAV core panel. (c) Exemplary micrographs of cells transduced with the AAV core panel variants. Untreated control wells are also shown. Green fluorescence: eGFP, blue staining: Hoechst33342. Scale bars = 100 μm. hu, human; m, murine.

