Figure 3.
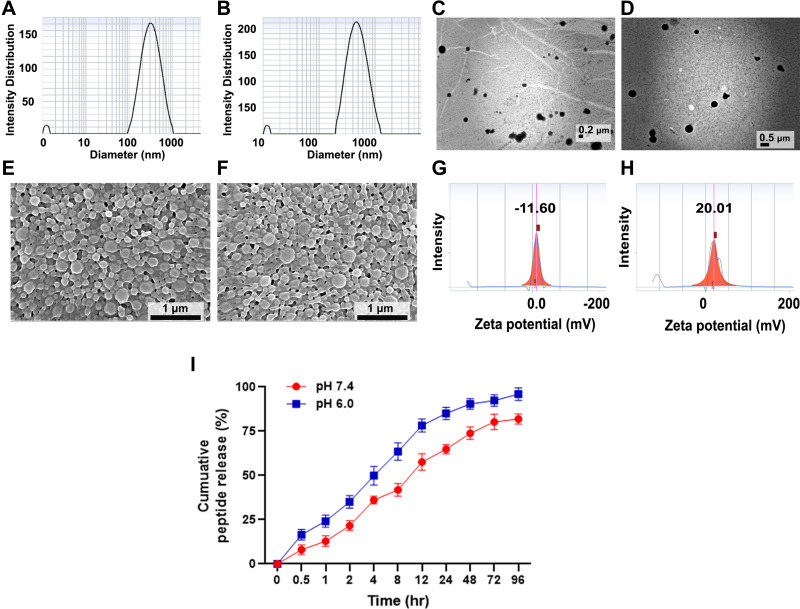
Characterisation of Pep5-PLGA nanoparticle and Pep5-TPPN using DLS for particle size and zeta potential analysis, TEM and SEM. Particle size distribution of (A) Pep5-PLGA nanoparticles and (B) Pep5-TPPN by DLS. TEM analysis for the size measurement of (C) Pep5-PLGA nanoparticles (scale bar=2µm) and (D) Pep5-TPPN nanoparticles (scale bar=5µm). SEM analysis for the size and morphology analysis of (E) Pep5-PLGA nanoparticles (scale bar = 1 µm) and (F) Pep5-TPPN nanoparticles (scale bar = 1µm). Zeta potential curve of (G) Pep5-PLGA nanoparticles and (H) Pep5-TPPN by DLS. (I) In vitro peptide release profile of Pep5-TPPN over 96 hours at pH 7.4 and 6.0. The results shown for each time point represent the mean ± standard deviation for three independent experiments each conducted in (n=3).

