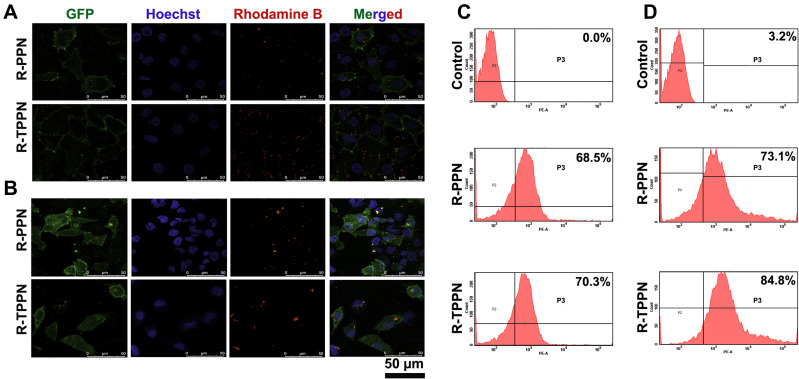
Figure 4.
In vitro cellular uptake of R-PPN and R-TPPN. Confocal images of cell internalization of R-PPN and R-TPPN on (A) MCF7 and (B) PM TORCAR MDA-MB-231 cells at 4 hours. For all images, scale bar is 50 µm. Quantification of cellular uptake of R-PPN and R-TPPN using flow cytometry on (C) MCF7 and (D) MDA-MB-231 cells.

