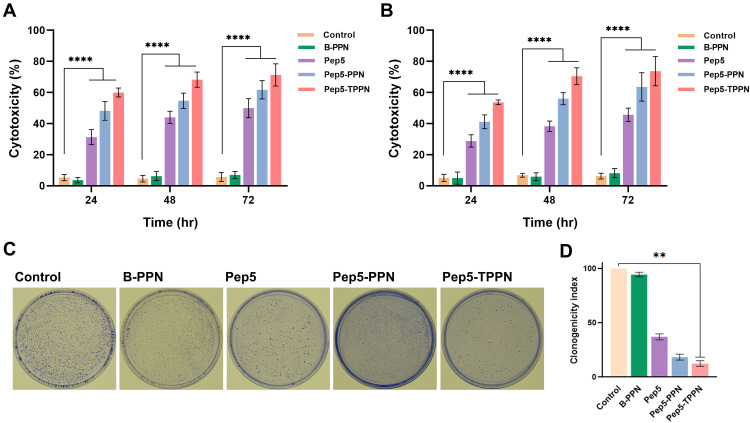
Figure 5.
In vitro cytotoxicity analysis of Pep5 formulations by MTT and clonogenic assay. In vitro cytotoxicity analysis of Pep5, Pep5-PPN and Pep5-TPPN by MTT on (A) MCF7 cells and (B) MDA MB 231 cells. The results shown for each concentration point represent the mean ± standard deviation for three independent experiments, each conducted in n=3 (****p < 0.0001). (C) Images of clonogenic assay on MCF7 cells and (D) graphical representation of clonogenicity index. Data are represented as mean ±SD for n = 3 (**p < 0.01).

