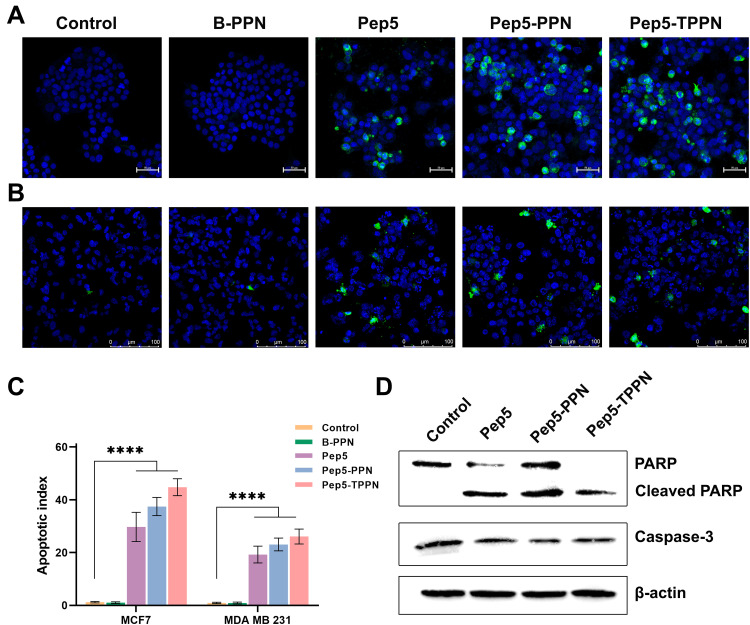
Figure 9.
Analysis of apoptosis by immunofluorescence and Western blotting. Representative images of immunofluorescence for detecting cleaved Caspase-3 (green color) on (A) MCF7 cells and (B) MDA-MB-231 after treating with B-PPN, Pep5, Pep5-PPN, Pep5-TPPN. (C) Graphical representation of apoptotic index (Data are represented as mean ±SD for n = 3 (****p < 0.0001). (D) Western blot analysis showing PARP and Caspase 3 cleavage induced by B-PPN, Pep5, Pep5-PPN, and Pep5-TPPN on MDA MB 231 cells.

