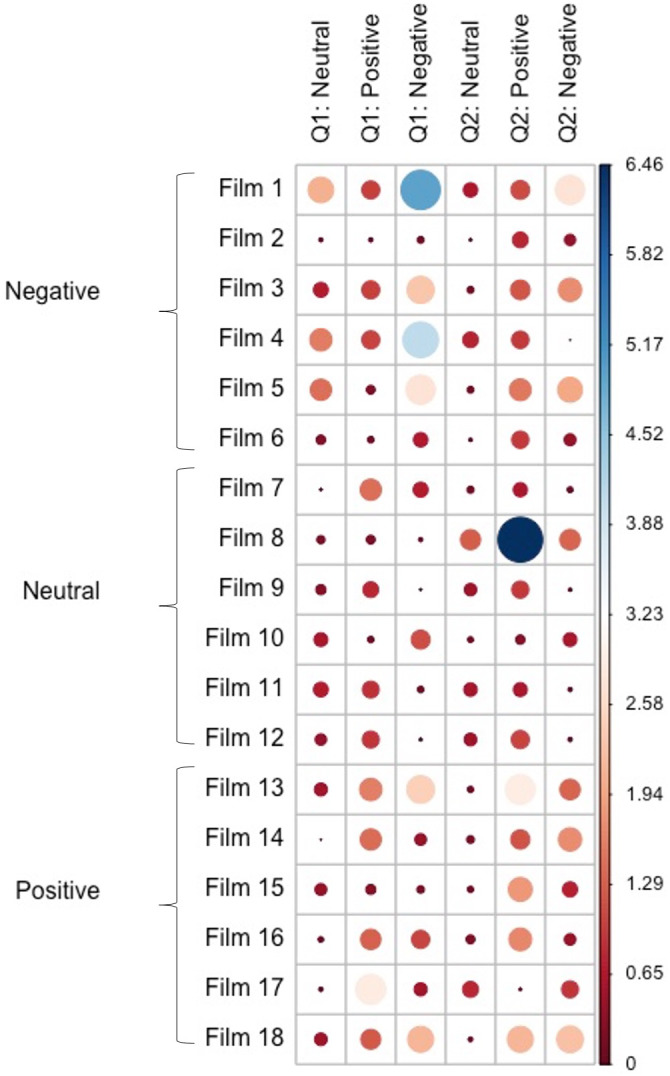
Figure 1. χ2 contribution plot.

The dots indicate contribution each film clip made to a specific interpretation category. Larger blue dots indicate higher contribution and lower ambiguity with most participants offering the same type of interpretation.
