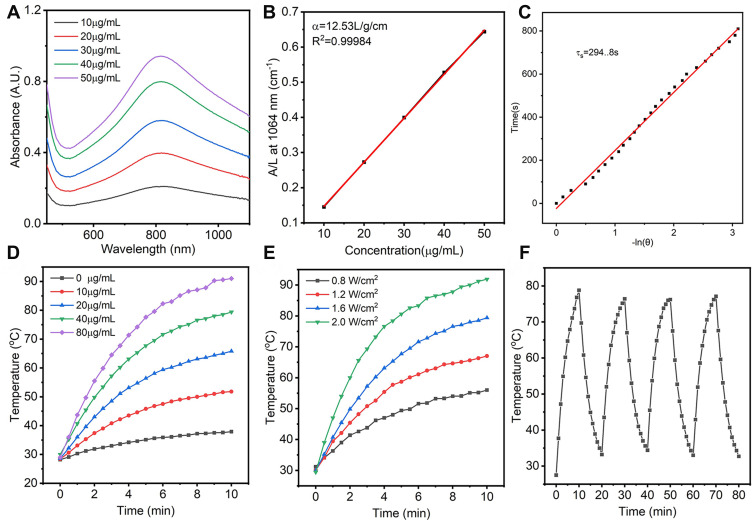
Figure 2.
Photothermal conversion performance of HPW@PANI Nanorods. (A) The absorption spectrum of HPW@PANI nanorods with different concentration. (B) Fitting curve of mass extinction coefficient of HPW@PANI Nanorods at 1064 nm. (C) Linear time constant calculated from the cooling period. (D) The temperature curve of HPW@PANI Nanorods (40 μg/mL) under 1064 nm laser Irradiation with different power densities. (E) The temperature curve of HPW@PANI Nanorods with different concentrations under 1064 nm laser exposure (0.7 W/cm2). (F) Temperature rising and cooling cycles of HPW@PANI Nanorods (40 μg/mL).

