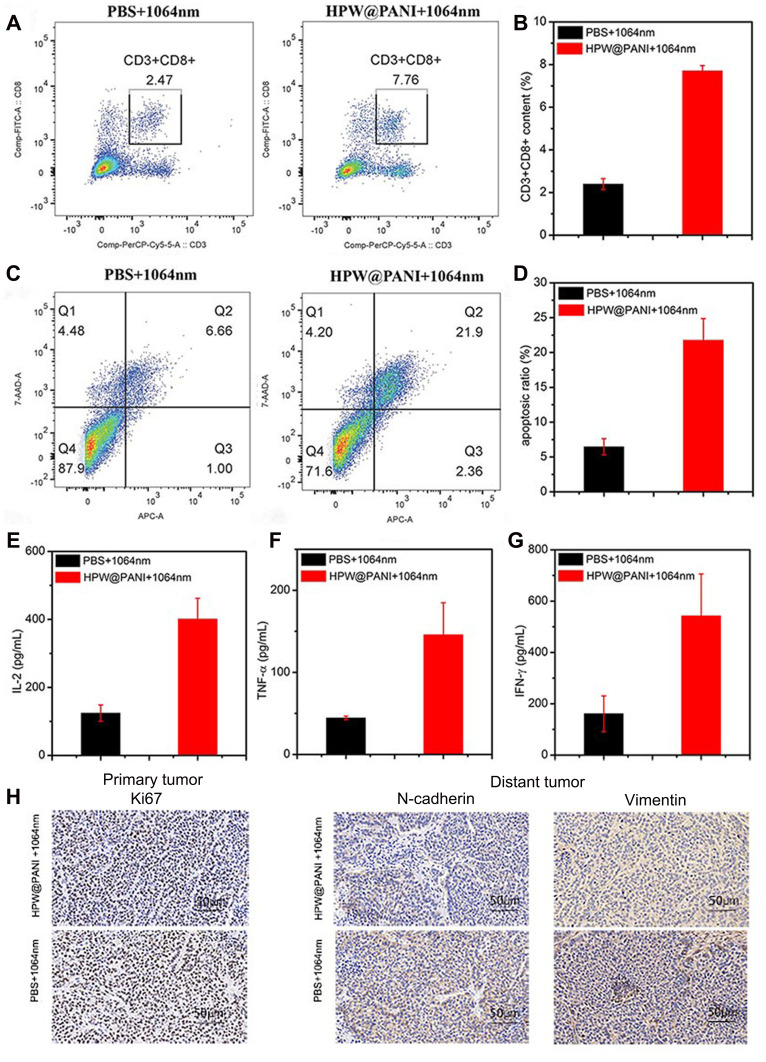
Figure 7.
(A) Representative flow cytometry plots of CD3+ and CD8+ T cells in distant tumor after different treatment. (B) The proportions of CD3+ and CD8+ T cells in distant tumor after different treatment. (C) Representative flow cytometry plots of VX 2 cells after co-cultured with T lymphocyte stimulated from spleen from different treatment group. (D) The proportions of apoptotic VX2 cells after co-cultured with T lymphocyte stimulated from spleen from different treatment groups. The cytokines concentration of IL-2 (E), TNF-α (F), and IFN-γ (G) secreted by T lymphocyte stimulated from spleen with the VX2 cells from different treatment group. (H) Detection of Ki67 expression in primary tumor and N-cadherin and Vimentin expression in distant tumor were performed by IHC.

