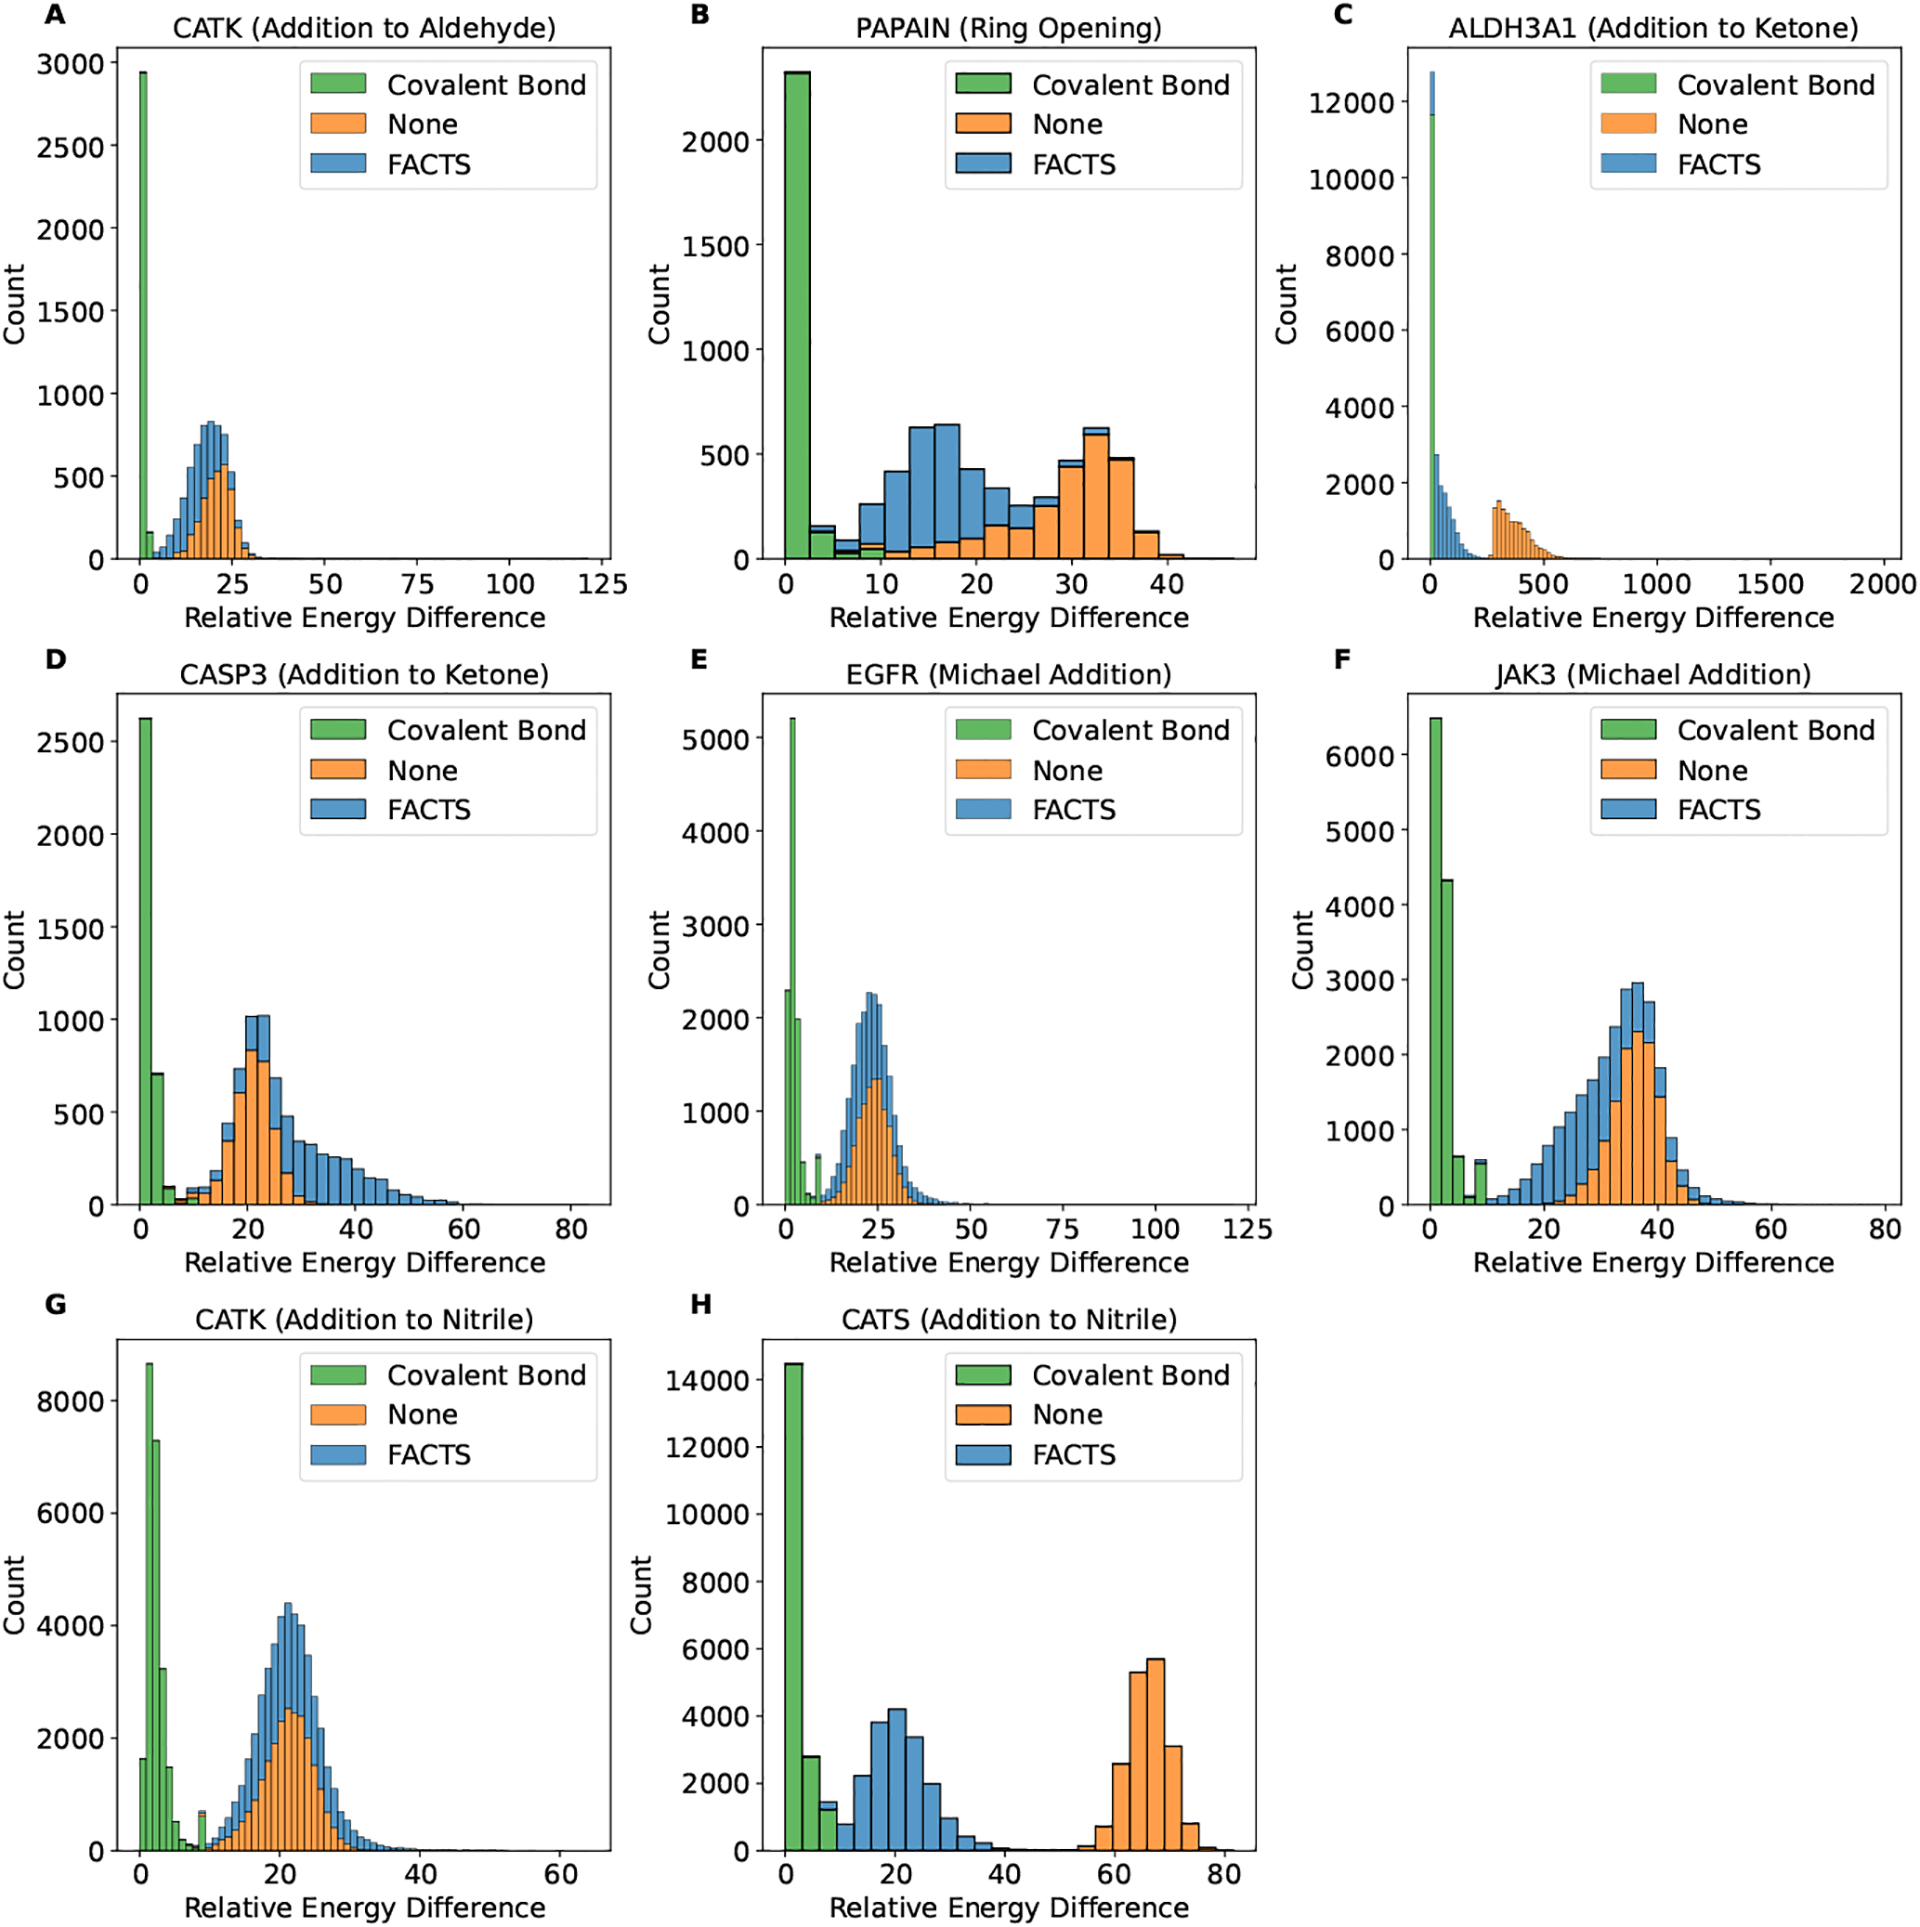
Fig. 2.

The distribution of the relative energy difference observed in the retrospective virtual screening for the receptor targets and the corresponding reaction type (A) CATK (addition to aldehyde), (B) PAPAIN (ring opening), (C) ALDH3A1 (addition to ketone), (D) CASP3 (addition to ketone), (E) EGFR (Michael addition), (F) JAK3 (Michael addition), (G) CATK (addition to nitrile) and (H) CATS (addition to nitrile). The energy differences plotted here are covalent bond formation energy Ecovalent (green), change of the system energy upon binding after subtracting the covalent bond formation energy (i.e., ΔGbinding−Ecovalent) in vacuum (orange) or using FACTS implicit solvent model (blue). The minimum energy for all comparison is set to be zero.
