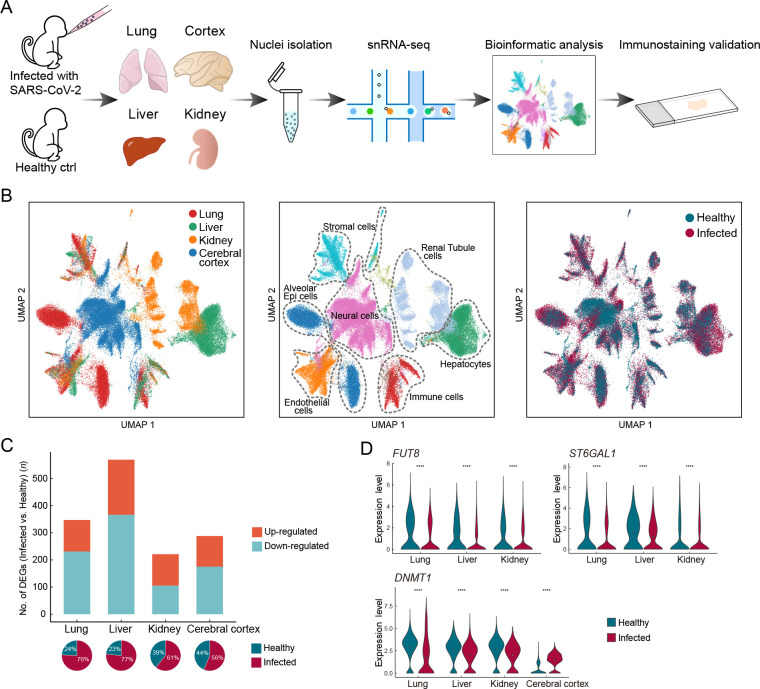
Figure 1.
Overview of single-nucleus transcriptomes from four organs in rhesus macaques
A: Study flowchart. B: UMAP of 77 029 nuclei captured in four organs from infected and healthy macaques, colored by organ (left), broad cell type (middle), and infection status (right). C: Bar plot showing number of infection-associated DEGs (|logFC|>0.7, adjusted P<0.05) at the all-cell level in each organ. Pie charts below show the percentage of nuclei from infected and healthy samples for each organ. D: Violin plots showing dysregulated expression of FUT8, ST6GAL1, and DNMT1 in multiple organs.

