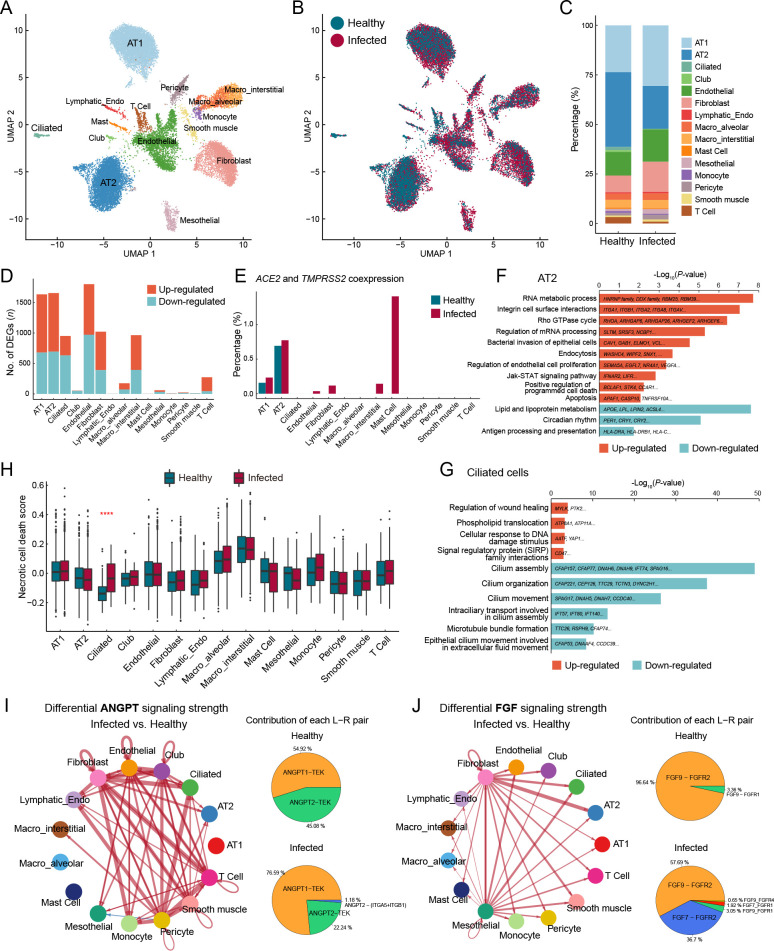
Figure 2.
Epithelial cell impairment and signaling pathway changes in macaque lungs after SARS-CoV-2 infection
A: Clusters and respective cell type assignments in UMAP. AT1, alveolar type 1 cell; AT2, alveolar type 2 cell; Lymphatic_Endo, lymphatic endothelial cell; Macro_interstitial, interstitial macrophage; Macro_alveolar, alveolar macrophage. B: Sample origin status of cells with the same embedding as in (A). In total, 22 141 single nuclei from lung tissues of infected (16 781 nuclei) and healthy (5 360 nuclei) animals were considered. C: Bar plot presenting proportion of each cell type in infected and healthy lungs. D: Bar plot showing numbers of DEGs (infected vs. healthy, |logFC|>0.25, adjusted P<0.05) in different cell types of the lung. E: Bar plot showing percentage of cells coexpressing ACE2 and TMPRSS2 in each cell type. F, G: GO and pathway enrichment analysis of infection-associated DEGs in AT2 cells (F) and ciliated cells (G). Representative genes are shown on the bar. H: Necrotic cell death score computed for different cell types, split by status. Genes in GOBP_NECROTIC_CELL_DEATH (GO: 0070265) were used to calculate the score. Statistical significance was determined by one-sided Wilcoxon rank-sum test, ****: P<0.0001. I, J: Differential cell communication in ANGPT signaling (I) and FGF signaling pathways (J) between infected and healthy samples found by CellChat. Circle plots (left) showing differential signaling strengths of infected samples compared to the healthy control. Red arrows represent enhanced communications, and arrow thickness represents differential amplitude. Pie plots (right) showing contribution of each ligand-receptor pair.

