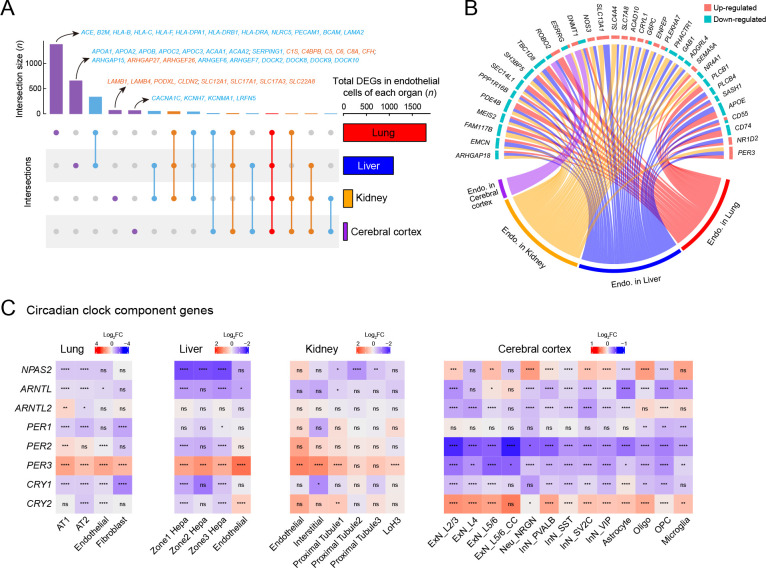
Figure 7.
Endothelial cell dysfunction and circadian rhythm disruption in multiple organs of SARS-CoV-2 infected rhesus macaques
A: UpSet plot showing a matrix layout of DEGs (infected vs. healthy, |logFC|>0.25, adjusted P<0.05) of endothelial cells shared across organs and specific to one organ. Each matrix column represents either DEGs specific to one organ (single circle with no vertical lines) or DEGs shared between organs (circles with vertical lines). Top, bar graph displaying number of DEGs in each combination. Representative genes are indicated for the four bars, which are specific to one given organ; red, up-regulated; blue, down-regulated. Right, bar graph displaying total number of DEGs in endothelial cells from a given organ. B: Circos plot showing common DEGs in endothelial cells of multiple organs. C: Heatmaps showing disrupted expression of core component genes of circadian clock in four organs. Statistical significance was determined by one-sided Wilcoxon rank-sum test for each block (ns is not significant; *: P<0.05; **: P<0.01; ***: P<0.001; ****: P<0.0001). Cell types that showed no significant changes in these genes were omitted.

