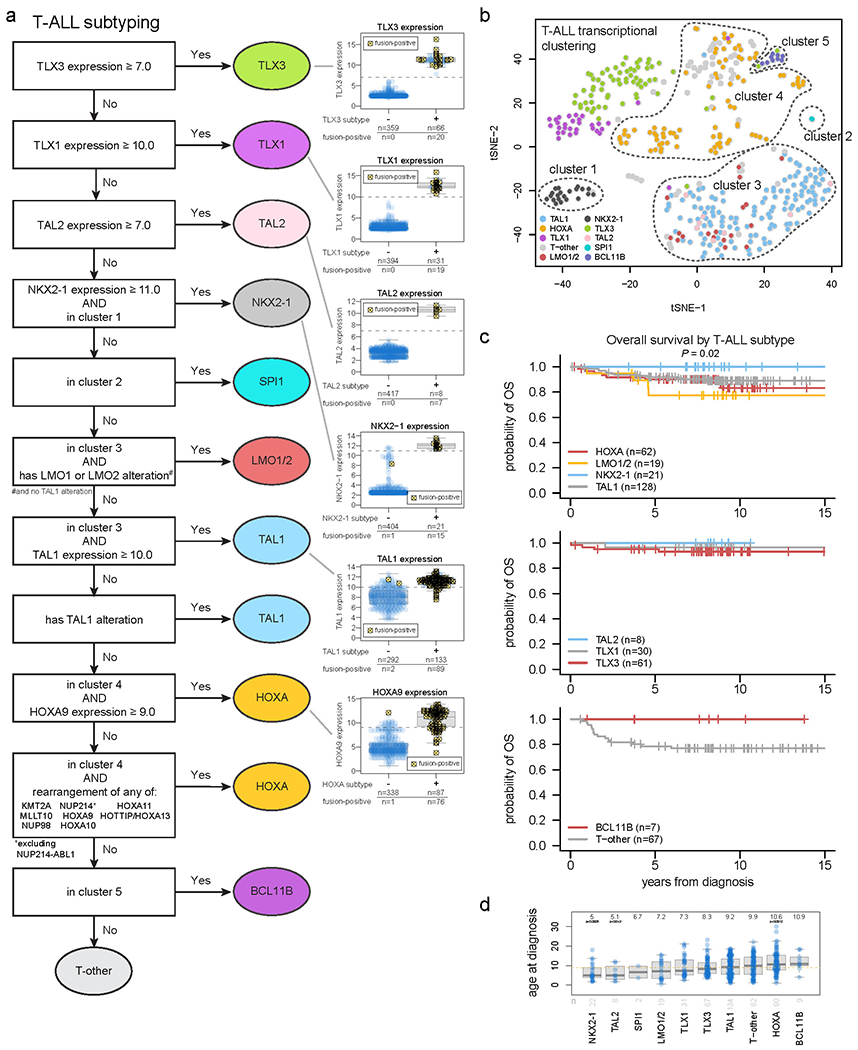
Extended Data Fig. 3. Subtype classification of T-ALL.

(a) Flow chart for T-ALL subtype classification and inclusion in clusters 1-4 as drawn on the tSNE plot. Classification begins at the top and samples meeting the indicated criteria are assigned to subtypes shown at right. Boxplots to the right show the expression of these genes in samples assigned to the indicated subtype (+) or not assigned (−). Samples bearing a detected fusion or rearrangement defining the subtype are marked with yellow circles with X marks. The gene expression thresholds indicated at left were determined based on the expression levels in fusion-positive samples. Samples where gene expression was above these thresholds but no fusion was detected were assumed to likely have a fusion and were thus assigned to that subtype, since the fusion may have been undetected due to technical issues (e.g. TLX3 enhancer hijacking rearrangements may be hard to detect with RNA-seq since they do not always create fusion transcripts). Boxplots show median (thick center line) and interquartile range (box). Whiskers are described in R boxplot documentation (a 1.5*interquartile range rule is used). (b) tSNE of T-ALL cases with RNA-seq. (c) Kaplan-Meier survival curves with overall survival distributions for each T-ALL subtype, shown in three graphs for ease of visualization. Subtypes with at least 5 samples are shown. P value shown is by two-sided log-rank test comparing all subtypes shown in all graphs. (d) Age at diagnosis by T-ALL subtype. Boxplot shows median (thick center line) and interquartile range (box). Whiskers are described in R boxplot documentation (a 1.5*interquartile range rule is used). Text at top shows median age in the subtype. P values compare ages from the subtype vs. all other T-ALL samples by two-sided Wilcoxon rank-sum test; P values ≤ 0.05 are shown. Numbers of patients are shown at bottom, and yellow line indicates median age across T-ALL.
