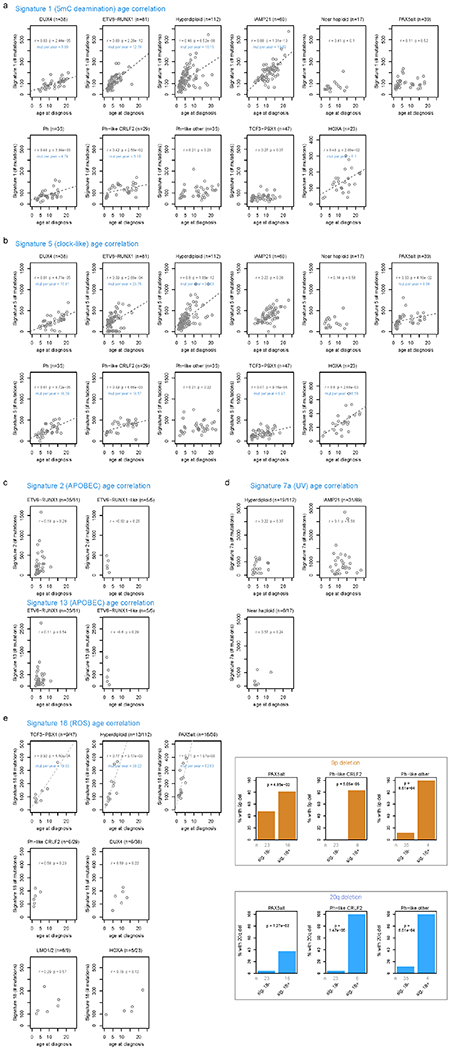
Extended Data Fig. 5. Correlation of COSMIC signatures with age and genetic alterations.

For each B-ALL and T-ALL subtype, the correlation between signature abundance (in number of SNVs, y-axis) and the age at diagnosis (x-axis) is shown. This includes samples sequenced by WGS which had mutational signature cosine similarities (comparing the sample profile vs. the profile as reconstructed by signatures) of 0.85 or above, and which also had available age information. Only subtypes with at least 5 samples meeting these criteria are shown, and the number of samples in each subtype are shown above each plot. Two-sided Pearson r correlation was performed to obtain the P and r values shown for each subtype. For subtypes with P < 0.05, linear regression was performed resulting in the linear fits shown, along with text indicating the slope of the line in mutations per year. (a) Signature 1 (5mC deamination). (b) Signature 5 (clock-like). (c) Signatures 2 and 13 (APOBEC). (d) Signature 7 (UV). (e) Signature 18 (ROS; left). Somatic alterations significantly correlating with signature 18 (right). Each somatic alteration (chromosome-level copy alterations and driver/putative driver genes) was tested for correlation with the presence vs. absence of signature 18, and 20q deletion and 9p deletion were significantly associated with signature 18 in the subtypes shown. P values are by two-sided Fisher’s exact test, and the number of samples in each group are shown below (n). Only WGS samples were analyzed.
