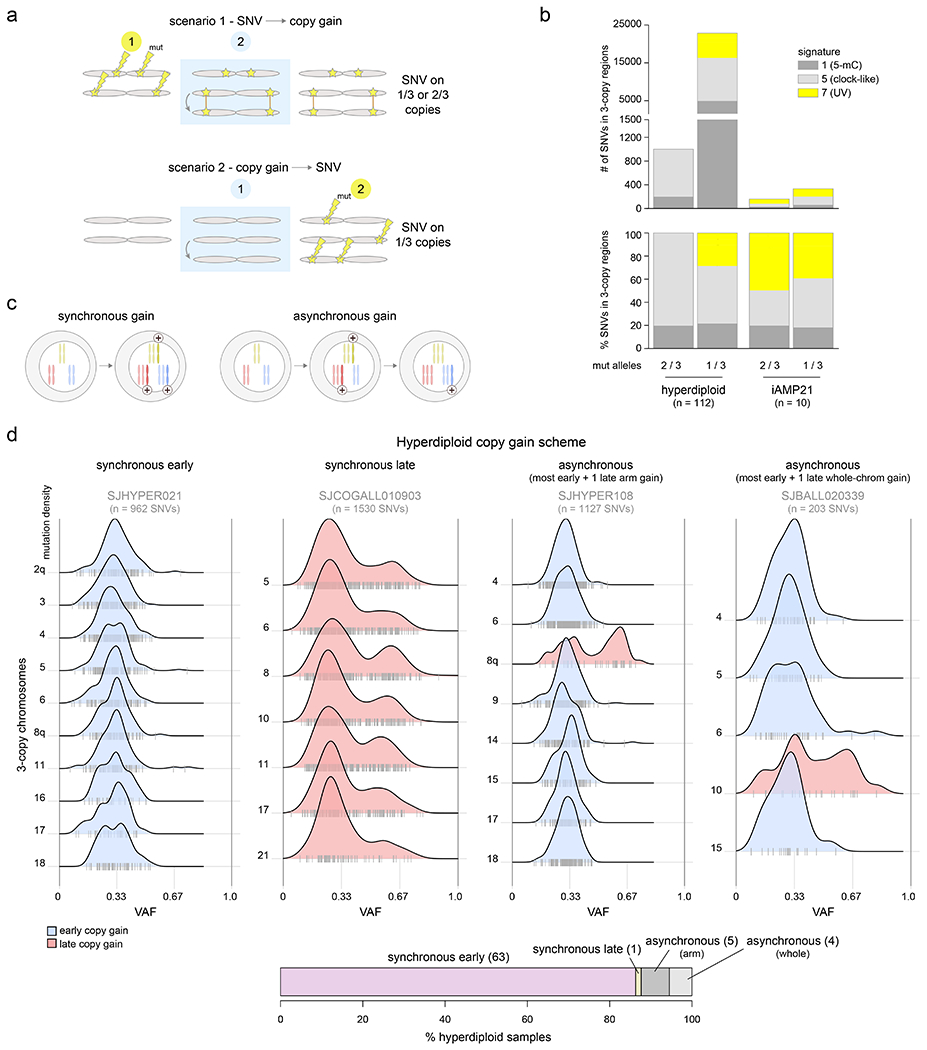
Figure 2. Temporal evolution of ultraviolet-associated mutations and copy gains in aneuploid B-ALL subtypes.

(a) Schematic showing how to infer whether copy gains occurred early or late (relative to the occurrence of SNVs). Two homologous chromosomes are shown before (left), during (blue shaded box), and after (right) a somatic gain of one of the two homologs. Top shows a scenario where SNVs (stars) occurred before copy gains, which would lead to half of SNVs being found on 1 of 3 copies and half on 2 of 3 copies, after the gain. Bottom shows a scenario where copy gains happened early, prior to SNVs, and thus all SNVs occur on 1 of 3 copies. (b) Mutational signature analysis pooling all somatic SNVs in 3-copy regions from B-ALL hyperdiploid (n=110 samples) or iAMP21 (n=7) samples (sequenced by WGS), separated into SNVs found on 1 of 3 copies (VAF ≈ 0.33) or 2 of 3 copies (VAF ≈ 0.67; see Methods). Top shows absolute number of SNVs and bottom shows relative number (percentage). (c) Scheme showing two possible modes of acquiring copy gains in hyperdiploid ALL. Left shows a scenario where all copy gains occur simultaneously (synchronous), such as during a single aberrant mitosis. Right shows sequential acquisition of copy gains (asynchronous) through multiple copy gain events occurring over time. (d) Copy gain schemes in hyperdiploid samples, to test whether copy gains likely occurred simultaneously or sequentially. Top shows examples of the four schemes that were detected across 72 hyperdiploid WGS samples, where only 3-copy chromosomes with at least 20 somatic SNVs in the sample were analyzed, and only samples with two or more chromosomes meeting this criterion were analyzed. On density plots, x-axes show VAF adjusted for tumor purity, and y-axes show mutation density for each 3-copy whole-chromosome or arm gain in the sample. Vertical ticks on the x-axis show individual SNV VAFs; an abundance of VAFs around 0.67 indicates late copy gains since the SNVs occurred prior to the copy gains (2 of 3 copies), while a preponderance of VAFs around 0.33 indicates early copy gains since most SNVs occurred after the copy gains (1 of 3 copies). Blue indicates an inferred early copy gain and red a late copy gain. Bottom shows the percentage of the 72 samples falling into each category. The density profiles for all 72 samples are shown in Extended data fig. 6.
