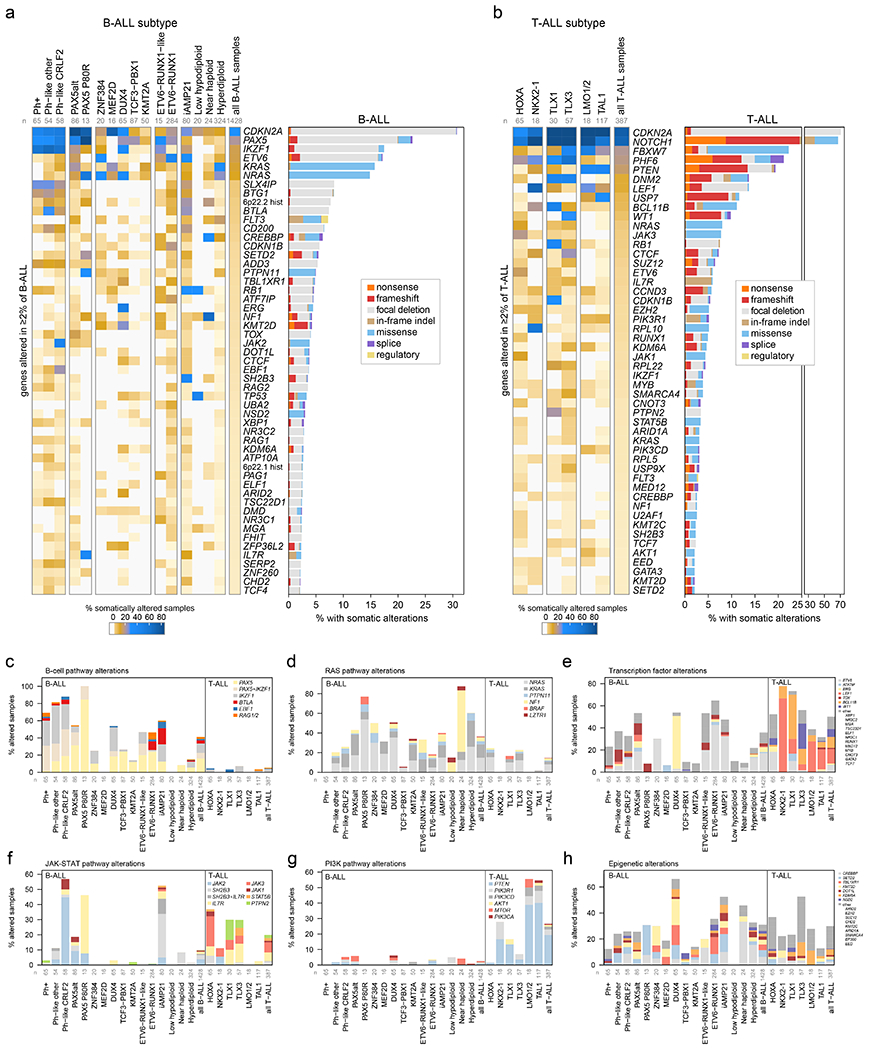
Figure 3. Mutational landscapes across ALL subtypes.

ALL samples with characterization of both somatic SNVs/indels and copy alterations are shown (WGS samples as well as WES samples which also had SNP array analysis), totaling 1,428 B-ALL and 387 T-ALL samples. Subtypes with at least 15 samples are shown. (a) Left, heatmap showing the percentage of samples in each subtype (column) with somatic alterations (excluding fusions) in all genes (rows) altered in at least 2% of B-ALL samples. Right shows the percentage of samples with alterations in each gene, with the alteration type indicated by color. In samples with more than one type of alteration, only the alteration higher up in the key list (starting with “nonsense”) is shown. “Regulatory” refers to FLT3-region focal deletions thought to increase FLT3 expression. n below subtype name indicates number of samples analyzed in each subtype. (b) As in (a) but for T-ALL. (c-h) Percent of samples with somatic alterations (excluding fusions) in each pathway, broken down by subtype. The specific gene altered is indicated in color. In samples where more than one gene is altered in the pathway, the gene towards the top of the legend is only shown. Frequently co-occurring gene alterations are shown as a separate color (e.g. samples with both PAX5 and IKZF1 alteration in (c)). Sample numbers for each subtype are as in (a-b).
