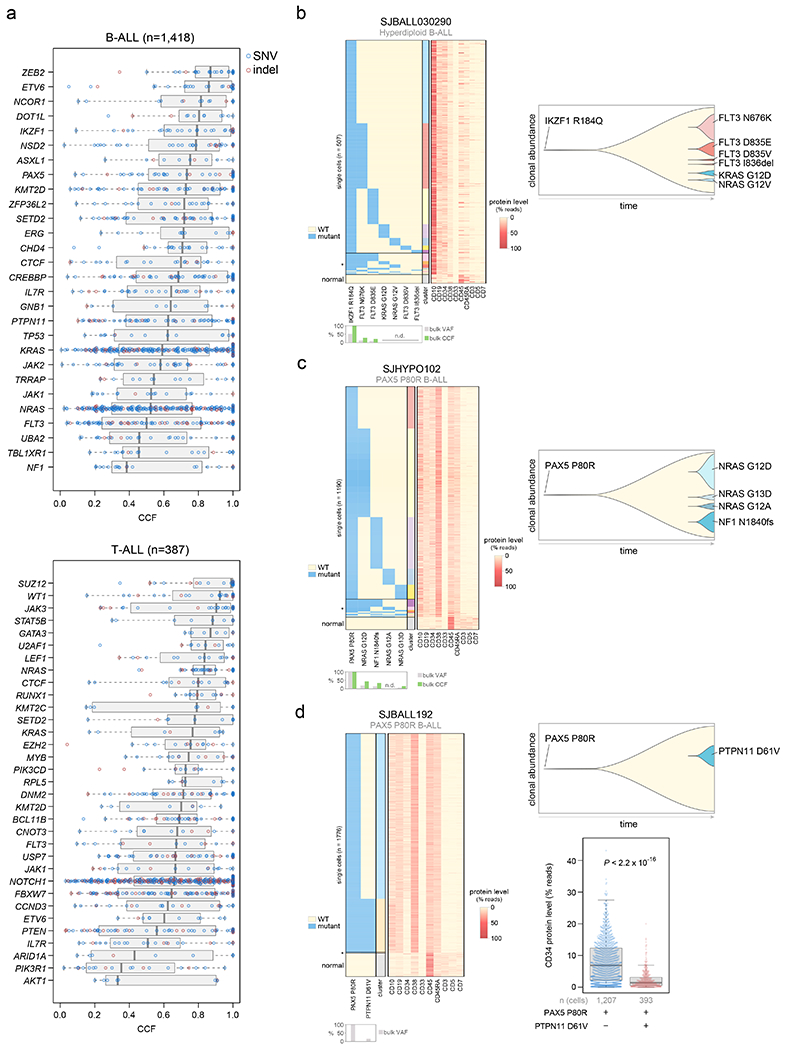
Figure 4. Clonality of driver SNVs and indels.

(a) The cancer cell fraction (CCF, x-axis), i.e. the percentage of cancer cells harboring each mutation, of alterations in each driver or putative driver gene is shown in all B-ALL samples (top) or all T-ALL samples (bottom). The CCF was calculated based on the VAF, copy number, and tumor purity of each sample; calculated CCFs above 1.0 were considered 1.0. Samples with both SNV/indel and copy number characterization (WGS or WES plus SNP array) are shown. Each plot shows the number of samples analyzed (n) at top. For most samples, only SNVs/indels in 2-copy regions were analyzed, except for near haploid and low hypodiploid where only SNVs/indels in 1-copy regions were analyzed. SNVs are shown in blue and indels in red; each point represents one somatic mutation. Boxplots show median (thick center line) and interquartile range (box). Whiskers are described in R boxplot documentation (a 1.5*interquartile range rule is used). Known or putative driver genes with at least 10 SNVs/indels in 2-copy regions across all B-ALL samples, or 8 SNVs/indels in 2-copy regions across all T-ALL samples, are shown. (b-d) Simultaneous targeted single-cell DNA sequencing and cell-surface protein expression analysis of three B-ALL samples using the Tapestri platform. Left shows a heatmap with each row representing one cell, and each column representing either one mutation (left side) or one protein (right side). Mutation presence is indicated by blue color, while protein level (as a percent of all protein-associated reads detected in the cell) is indicated by red color. Asterisk (*) indicates likely cell doublets or dropout artifacts, and below these likely normal cells are indicated (neither of which were included in the clonal composition determination at right). The bulk VAF of each mutation is indicated below, along with bulk CCF (if copy number was available). n.d., not detected in bulk sequencing. On the right side of each panel is shown a fish plot showing clonal composition as determined by single-cell sequencing, with x-direction indicating time and y-direction indicating relative CCF of each clone (represented by different colors) as determined by single-cell DNA sequencing. The rightmost edge shows the clonal composition at diagnosis. At bottom-right in (d), the cell-surface protein level of CD34 (percent of reads in each cell assigned to CD34), is shown in a clone with vs. without PTPN11 D61V in patient SJBALL192. P value is by two-sided Wilcoxon rank-sum test. Boxplot shows median (thick center line) and interquartile range (box). Whiskers are described in R boxplot documentation (a 1.5*interquartile range rule is used).
