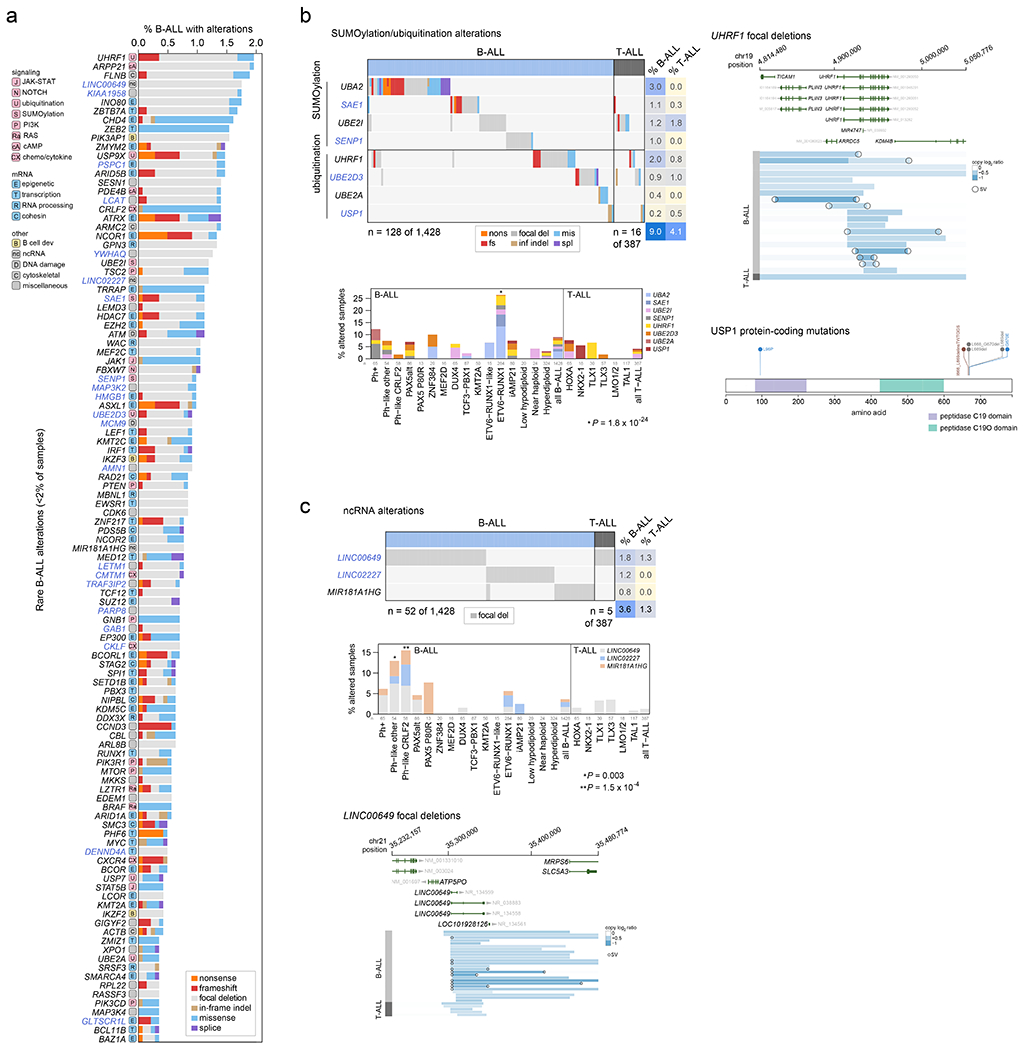
Figure 5. Alterations in rare ALL genes.

(a) Percent of B-ALL samples (out of 1,428 with either WGS or WES plus SNP array) with alterations in each infrequently altered gene (altered in <2% of B-ALL samples and ≥0.3% of samples). Alteration type is indicated in color; in samples with more than one type of alteration, only the alteration higher up in the key list (starting with “nonsense”) is shown. Putative driver genes not previously reported in cancer are shown in blue text. The pathway or function of each gene is indicated in boxed letters above each gene (see legend at bottom). (b) Alterations in selected genes involved in SUMOylation or ubiquitination, or the removal of these modifications. Left shows an oncoprint showing only samples with alterations in at least one of these genes, with alteration indicated by color and the percentage of samples in B-ALL or T-ALL altered at right. Bottom-left shows the percentage of each subtype with alterations in these genes, color-coded by the specific gene altered. In samples with alterations in more than one gene, only the top-most gene in the legend is shown. The value of n indicates the number of samples analyzed in each subtype. Right shows example gene alterations, including focal deletions (5 Mb or less; blue indicates degree of copy loss in each sample (row) and circles indicate SVs which were available for WGS samples only) in UHRF1 and sequence alterations in USP1. P value (asterisk) is by two-sided Fisher’s exact test comparing prevalence in the ETV6-RUNX1 subtype vs. all non-ETV6-RUNX1 B-ALL samples. (c) As in (b) but for putative driver alterations in non-coding RNA genes. P values (asterisks) are by two-sided Fisher’s exact test comparing prevalence in the indicated subtype vs. all B-ALL samples not belonging to that subtype.
