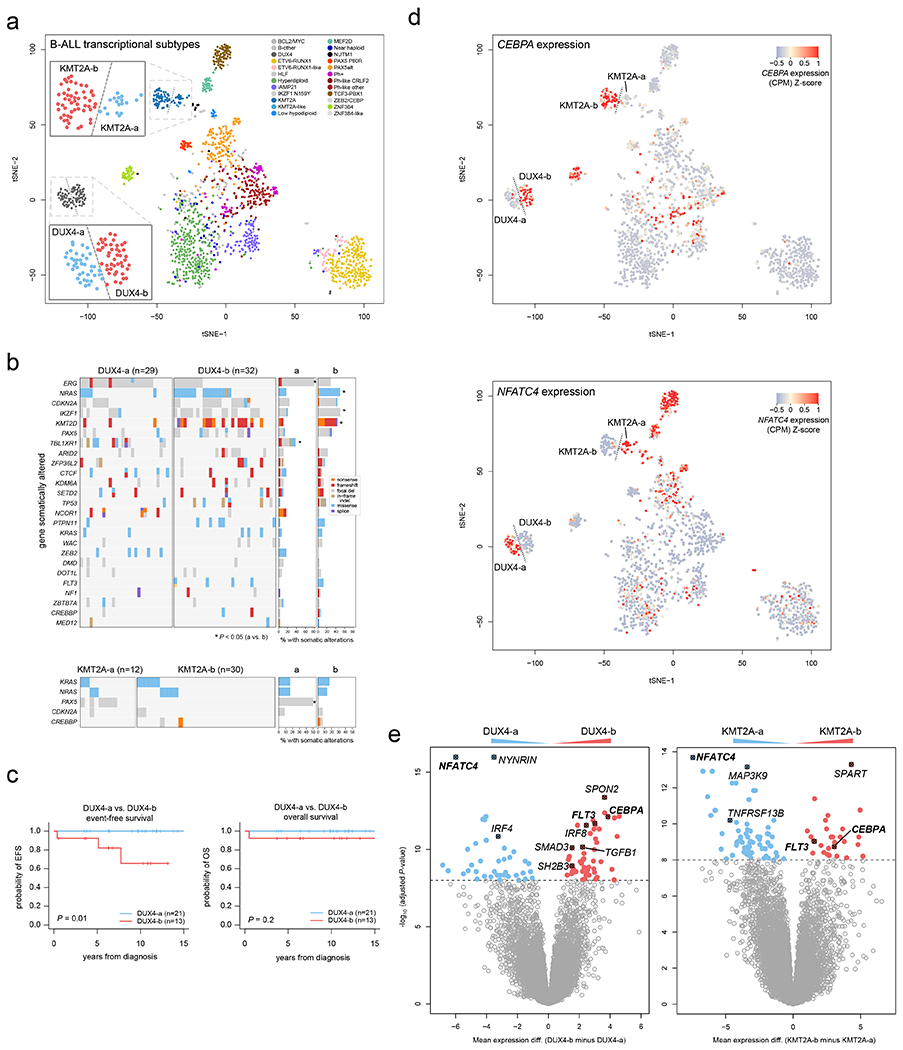
Figure 7. Dichotomous CEBPA and NFATC4 expression identifies subgroups of KMT2A-and DUX4-rearranged subtypes.

(a) tSNE analysis of B-ALL transcriptional profiles including 1,464 B-ALL samples sequenced by RNA-seq. Each point represents one sample. Legend shows the samples colored by subtype, and dotted lines delineate visually apparent subgroups further subdividing the KMT2A and DUX4 subtypes. Zoomed-in regions showing DUX4-a vs. DUX4-b and KMT2A-a vs. KMT2A-b subgroups are shown. (b) Heatmaps showing mutations present in DUX4-a vs. DUX4-b (top), or KMT2A-a vs. KMT2A-b (bottom) subgroups. Each row indicates a gene somatically altered in the subtype, sorted by most frequently (top) to least frequently (bottom) altered within the DUX4 or KMT2A subtype. Each column is one sample. Right indicates the percentage of samples with somatic alterations in each gene in the a vs. b subgroups, with significant P values by two-sided Fisher’s exact test (a vs. b subgroups) shown with asterisks. Exact P values are 9.3 x 10⁻⁵ (ERG), 0.014 (NRAS), 0.032 (IKZF1), 0.0045 (KMT2D), 8.3 x 10⁻⁵ (TBL1XR1), and 1.8 x 10⁻⁴ (PAX5). Variant types are indicated by color as shown in the key at right in the DUX4 plot. This analysis includes samples that had RNA-seq, SNV/indel, and copy number characterisation (RNA-seq plus WGS, or RNA-seq plus WES plus SNP array), with sample numbers indicated above each plot. (c) Kaplan-Meier curves showing event-free (left) or overall survival comparing DUX4-a and DUX4-b subgroups. P values are by two-sided log-rank test. (d) tSNE plots as in (a), including 1,464 B-ALL samples, except that the expression of CEBPA (top) or NFATC4 (bottom) are indicated by color, with red indicating high expression and blue/gray indicating lower expression (see scale). (e) Left, differential gene expression with Limma, comparing the DUX4-a (n=36 samples) and DUX4-b (n=43) subgroups, defined as shown in (a). X-axis represents the log2 fold change in gene expression comparing DUX4-b minus DUX4-a, where values above zero indicate an increase in DUX4-b and below zero indicate an increase in DUX4-a. Y-axis represents the −1*log10 (adjusted P value) for each gene (represented as points). The top differentially expressed genes are shown in red (increased in DUX4-b) or blue (increased in DUX4-a), and selected genes are highlighted. Right, differential gene expression comparing KMT2A-a (n=17) vs. KMT2A-b (n=45).
