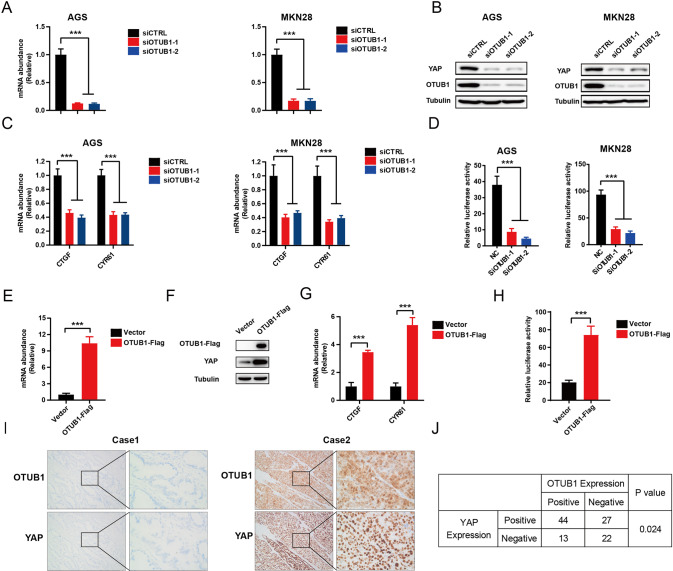
Fig. 2. OTUB1 positively regulate Hippo pathway in gastric cancer cell lines.
A RT–qPCR results of OTUB1 mRNA expression in AGS (left panel) or MKN28 (right panel) cell line transfected with scrambled or two independent siRNA targeting OTUB1 for 48 h, respectively. B Western blot results showing the expression level of YAP and OTUB1 in AGS (left panel) or MKN28 (right panel) cell line transfected with scrambled or two independent siRNA targeting OTUB1 for 48 h, respectively. C RT–qPCR results of CTGF and CYR61 mRNA expression in AGS (left panel) or MKN28 (right panel) cell line transfected with scrambled or two independent siRNA targeting OTUB1 for 48 h, respectively. D Transcriptional activity of TEAD measured by luciferase assay with a reporter containing tandem TEAD-binding sites in AGS (left panel) or MKN28 (right panel) cell line transfected with scrambled or two independent siRNA targeting OTUB1 for 48 h, respectively. E RT–qPCR results of OTUB1 mRNA expression in MKN28 cell line stable expressing OTUB1-flag or lentiviral vector. F Western blot results showing the expression level of YAP and OTUB1 in MKN28 cell line stable expressing OTUB1-flag or lentiviral vector. G RT–qPCR results of CTGF and CYR61 mRNA expression in MKN28 cell line stable expressing OTUB1-flag or lentiviral vector. H Transcriptional activity of TEAD measured by luciferase assay with a reporter containing tandem TEAD-binding sites in MKN28 cell line stable expressing OTUB1-flag or lentiviral vector. I Immunohistochemistry (IHC) detecting OTUB1 and YAP expression in gastric cancer specimen. J Chi-square test to determine the correlation between OTUB1 and YAP. Data are normalized to the values of the control group and are presented as mean ± SEM. One-way ANOVA is conducted to detect significant differences in panel A, C, D. The t-test is conducted to detect significant differences in panel E, G, H (*P < 0.05, **P < 0.01, ***P < 0.001).

