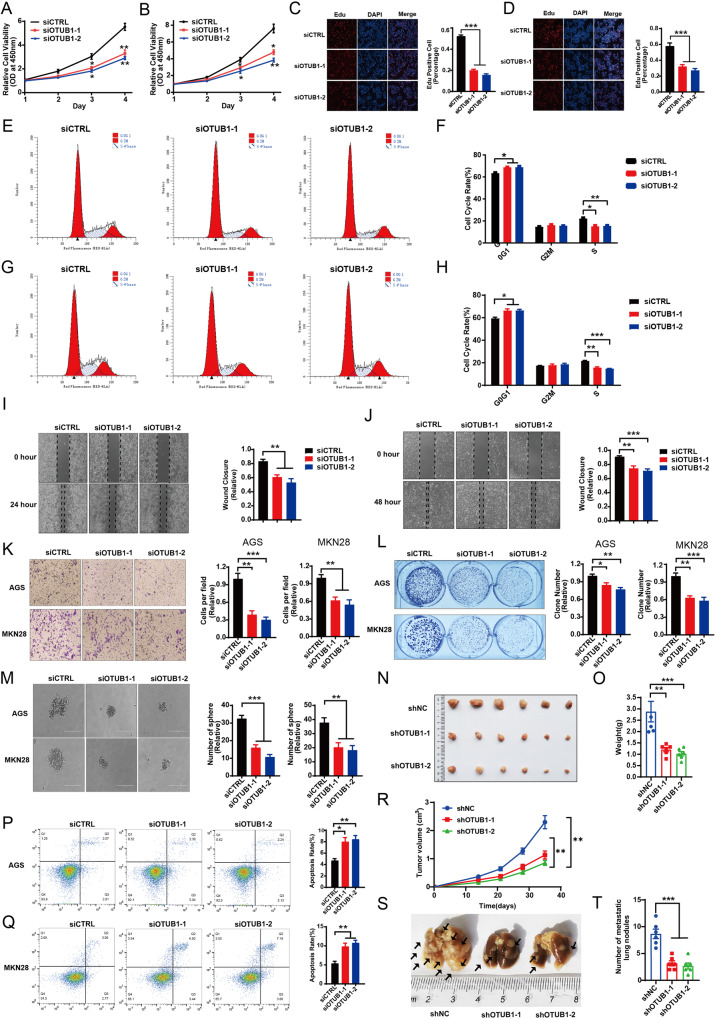
Fig. 3. OTUB1 is required for gastric cancer cell progression.
A Cell viability was determined by CCK8 assay in the AGS cell line transfected with either scrambled (si-CTRL) or two independent OTUB1 siRNA (si-OTUB1). B Cell viability was determined by CCK8 assay in the MKN28 cell lines transfected with either scrambled (si-CTRL) or two independent OTUB1 siRNA (si-OTUB1). C EdU assay (left panel) to show the cell proliferation of AGS cell line transfected with either scrambled (si-CTRL) or two independent OTUB1 siRNA (si-OTUB1). Right panel shows quantification of EdU results. D EdU assay to show the cell proliferation of MKN28 cell line transfected with either scrambled (si-CTRL) or two independent OTUB1 siRNA (si-OTUB1). Right panel shows quantification of EdU results. E Representative cell-cycle analysis by flow cytometry of AGS cells transfected with either scrambled (si-CTRL) or two independent OTUB1 siRNA (si-OTUB1). F The histogram shows quantification of cell-cycle results in AGS cells. G Representative cell-cycle analysis (left panel) by flow cytometry of KMN28 cells transfected with either scrambled (si-CTRL) or two independent OTUB1 siRNA (si-OTUB1). H The histogram shows quantification of cell-cycle results in KMN28 cells. I Wound healing assay (left panel) of AGS cell migration capability following transfected with either scrambled (si-CTRL) or two independent OTUB1 siRNA (si-OTUB1). Right panel shows quantification of wound healing results. J Wound healing assay (left panel) of KMN28 cell migration capability following transfected with either scrambled (si-CTRL) or two independent OTUB1 siRNA (si-OTUB1). Right panel shows quantification of wound healing results. K Transwell assay (left panel) of AGS and MKN28 cell transfected with either scrambled (si-CTRL) or two independent OTUB1 siRNA (si-OTUB1), respectively. Right panel shows quantification of transwell assay results. L Colony formation (left panel) of AGS cells or MKN28 cells transfected with either scrambled (si-CTRL) or two independent OTUB1 siRNA (si-OTUB1), respectively. Right panel shows quantification of colony formation assay results. M Spheroid formation in 3D culture AGS and MKN28 cell transfected with either scrambled (si-CTRL) or two independent OTUB1 siRNA (si-OTUB1), respectively. Left panel shows microscopic images of spheroids, and right panel shows the quantification of spheroids. N Representative image of tumor derived from NSG mice injected with control or OTUB1-depleted MKN28 cells is followed as indicated. O Quantitative tumor weight of tumors was shown. P Representative plots (left panel) of apoptosis ASG cell transfected with either scrambled (si-CTRL) or two independent OTUB1 siRNA (si-OTUB1), respectively. Quantitative summary (right panel) of apoptosis analysis of FACS. Q Quantitative tumor volumes from NSG mice injected with control or OTUB1-depleted MKN28 cells are measured at indicated time points. R Representative plots (left panel) of apoptosis MKN28 cell transfected with either scrambled (si-CTRL) or two independent OTUB1 siRNA (si-OTUB1), respectively. Quantitative summary (right panel) of apoptosis analysis of FACS. S Representative image of In vivo lung metastasis of indicated MKN28 cells were indicated. T Quantitative analysis of tumor metastasis in (S). All data are shown as mean ± SEM. *p < 0.05, **p < 0.01, ***p < 0.001 by one-way ANOVA.

