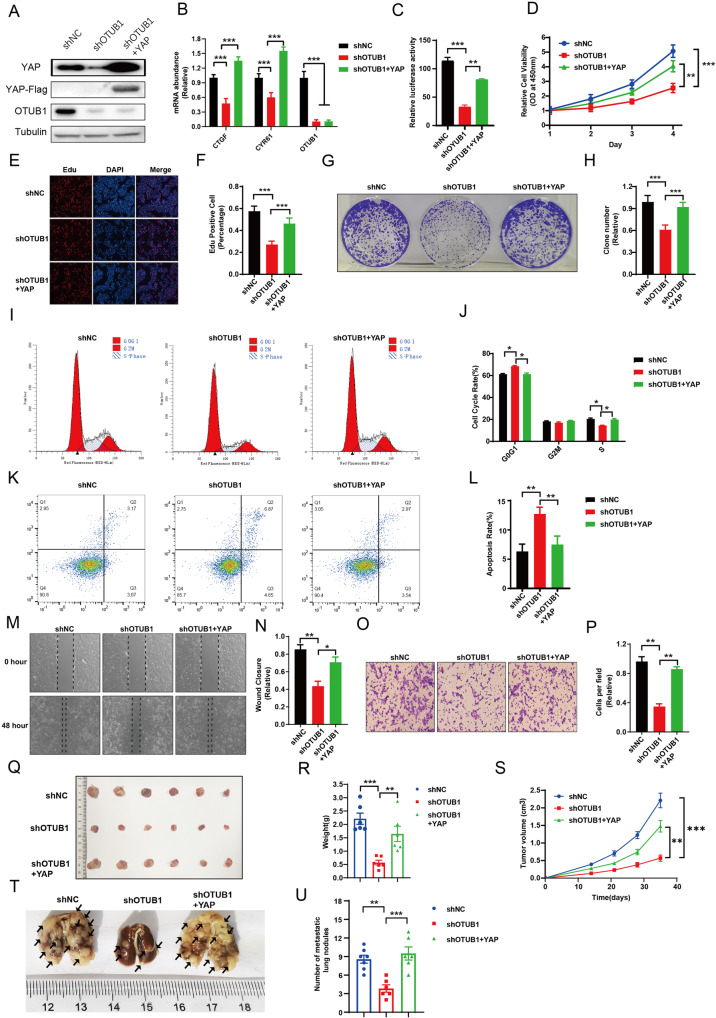
Fig. 4. YAP rescues the defects of gastric cancer cells induced by OTUB1 depletion.
A–P MKN28 cells were transduced with lentiviruses expressing control or shRNA targeting OTUB1, following with YAP overexpression. A MKN28 cells were subjected to immunoblotting as indicated. Flag was fused to YAP. Tubulin served as loading control. B Relative RNA level of CTGF and CYR61 in indicated MKN28 cells was measured. C Relative YAP-TEAD luciferase activity was measured in MKN28 cells as indicated. D Cell growth of MKN28 cells were measured by CCK-8 assay. E, F Cell proliferation of indicated MKN28 cells were measured by EdU staining. E Representative image of EdU staining. F Quantitative analysis of EdU staining in E. G, H Clone formation of MKN28 cells were measured as indicated. G Representative image to show crystal violet staining of clones. H Quantitative summary of clones in G. I, J Cell cycle of indicated MKN28 cells were measured by FACs. I Representative cell cycle plots by FACs. J Quantitative summary of cell cycle analysis in (I). K, L Apoptosis of indicated MKN28 cells were measured by FACs. K Representative plots of cell apoptosis by FACs. L Quantitative summary of apoptosis analysis in K. M, N Cell migration of MKN28 cells was measured by wound-healing assay as indicated. M Representative cell image of wound-healing assay. N Quantitative summary of wound-healing assay in M. O, P Cell invasion of indicated MKN28 cells was measured by trans-well assay. O Representative cell image of trans-well assay. N Quantitative summary of trans-well assay in O. Q–U MKN28 cells were transduced with lentiviruses expressing control or shRNA targeting OTUB1, following with YAP overexpression. Q–S Control, OTUB1-depleted or OTUB1-depleted with ectopic YAP expressed MKN28 cells were injected into NSG mice and tumor growth was followed as indicated. Representative image(Q) and quantitative tumor weight (R) were shown. Quantitative tumor volumes were measured at indicated time points. T, U In vivo lung metastasis of indicated MKN28 cells were measured. T Representative image to show the lung metastasis of tumors. U Quantitative analysis of tumor metastasis in T. All data are shown as mean ± SEM. *p < 0.05, **p < 0.01, ***p < 0.001 by one-way ANOVA.

