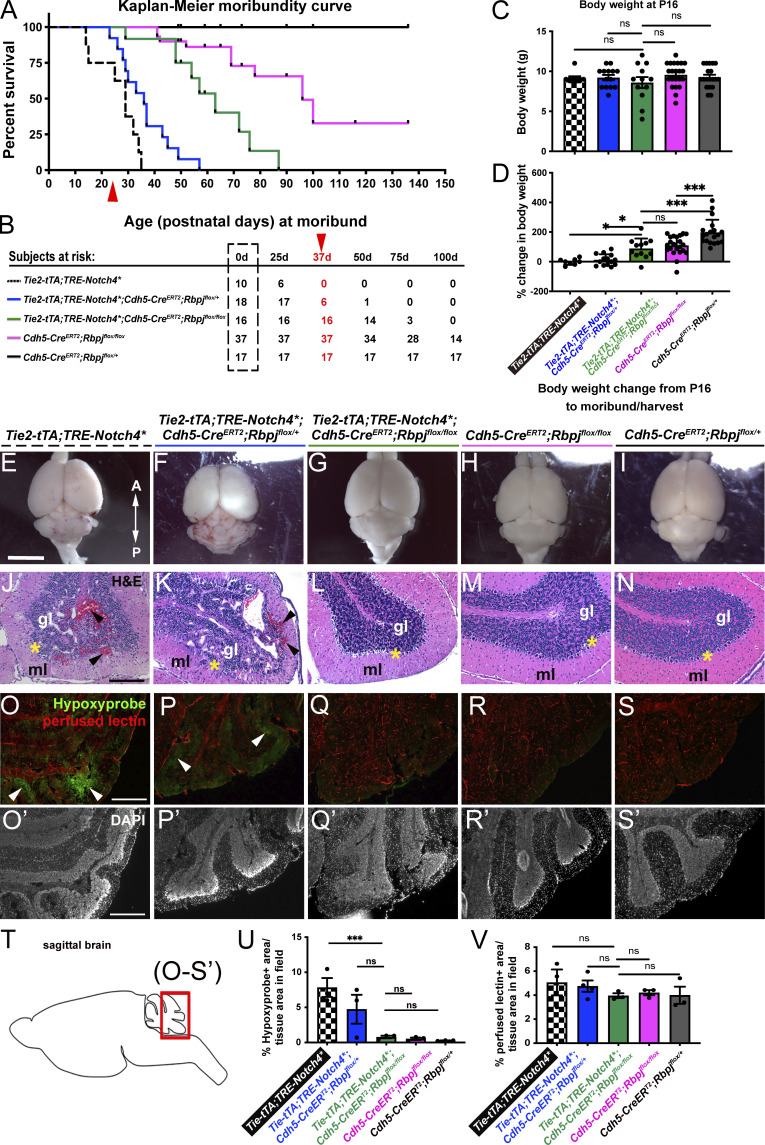
Figure 2.
Endothelial deletion of Rbpj from P16 reduced the time to moribundity, body weight loss, intracerebral hemorrhage, histopathological abnormalities, and tissue hypoxia in Notch4*tetEC mice. (A) Kaplan–Meier analysis showed that time to moribundity doubled in Notch4*tetEC;RbpjiΔEC mice (green line), as compared with Notch4*tetEC mice (dashed black line). P < 0.0001. Red arrowhead indicates age (P36) past which no Notch4*tetEC mice are expected to survive. Notch4*tetEC;RbpjiΔEC-het mice (blue line) did not increase time to moribundity, as compared to Notch4*tetEC mice. RbpjiΔEC mice (pink line) increased time to moribundity but did not match the curve of negative control mice (solid black line). 13 independently repeated experiments. (B) Numbers of subjects at risk at 0, 25, 50, 75, 100 d old were used to generate Kaplan–Meier curve. Red arrowhead indicates age (P36) past which no Notch4*tetEC mice are expected to survive. (C) At P16, the age of initial TAM injection to induce RbpjiΔEC deletion, body weights of mice in all genotypic cohorts were not significantly different from one another. (D) Changes in body weights, from P16 to time of moribundity/tissue harvest, were calculated. Notch4*tetEC;RbpjiΔEC mice (green bar, N = 12; 86.90 ± 78.87%) gained significantly more weight than Notch4*tetEC mice (checkered bar, N = 8; −0.49 ± 20.71%) and Notch4*tetEC;RbpjiΔEC-het mice (blue bar, N = 14; 17.18 ± 39.19%); however, Notch4*tetEC;RbpjiΔEC mice (green bar) did not reach weight gain of negative control mice (dark gray bar, N = 20; 159.83 ± 45.18%). Notably, RbpjiΔEC mice (pink bar, N = 23; 99.15 ± 52.30%) did not reach weight gain of control mice (dark gray bar). Six independently repeated experiments. (E–I) Saline-perfused whole brain showed areas of hemorrhage in Notch4*tetEC and Notch4*tetEC;RbpjiΔEC-het brains but not in Notch4*tetEC;RbpjiΔEC, RbpjiΔEC, or negative control brains. A, anterior; P, posterior. Mice from six litters or six independently repeated experiments. (J–N) Hemorrhage (arrowheads) and disrupted cerebellar layers were observed by H&E histological staining in Notch4*tetEC and Notch4*tetEC;RbpjiΔEC-het cerebellum, but not in Notch4*tetEC;RbpjiΔEC, RbpjiΔEC, or negative control cerebellum. Asterisk indicates Purkinje layer. gl, granule layer; ml, molecular layer. Two independently repeated experiments. (O–S′) Hypoxyprobe immunostaining showed regions of hypoxic cells (arrowheads) in Notch4*tetEC (7.83 ± 2.34%, N = 3) and Notch4*tetEC;RbpjiΔEC-het (4.73 ± 3.57%, N = 3) cerebellum but not in Notch4*tetEC;RbpjiΔEC (0.79 ± 0.31%, N = 3), RbpjiΔEC (0.52 ± 0.30%, N = 3), or negative control (0.25 ± 0.05%, N = 3) cerebellum. Quantified in (U). Lectin-positive staining indicated perfused vessels. Notch4*tetEC (5.06 ± 1.87%, N = 3); Notch4*tetEC;RbpjiΔEC-het (4.72 ± 1.16%, N = 4); Notch4*tetEC;RbpjiΔEC (3.96 ± 0.34%, N = 3); RbpjiΔEC (4.21 ± 0.37%, N = 3); negative control (4.00 ± 1.23%, N = 3). Quantified in (V). Four independently repeated experiments. (T) Schematic indicates the cerebellar region of sagittal brain section shown in O–S′. Scale bars: 5 mm in E–I; 200 μm in J–N; 400 μm in O–S′. *P<0.05; ***P<0.001.

