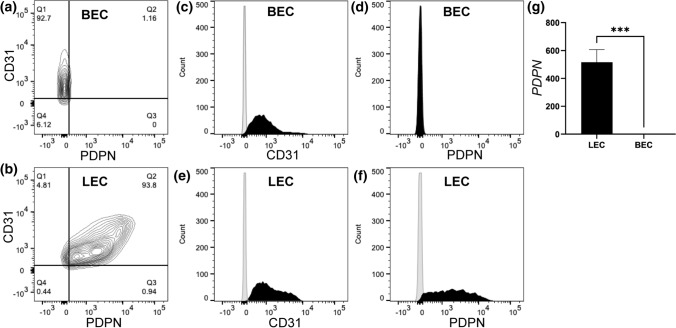
Figure 1.
BECs and LECs express unique endothelial surface markers. Representative flow cytometry diagrams demonstrating unique endothelial surface markers for PDPN and CD31. (a) BEC (92.7%) showing CD31+ and PDPN−, while (b) LEC showing CD31+ and PDPN+. Representative flow cytometry histograms indicating (c and d) BEC and (e and f) LEC stained with CD31-PE (in black), PDPN-FITC (in black), and isotype controls (in grey). (g) Real-time quantitative qRT-PCR was used to analyze PDPN expression for LEC and BEC relative to GAPDH. Data represents mean SD, n = 4 per group, ***p < 0.001. All p values were determined by unpaired t tests.

