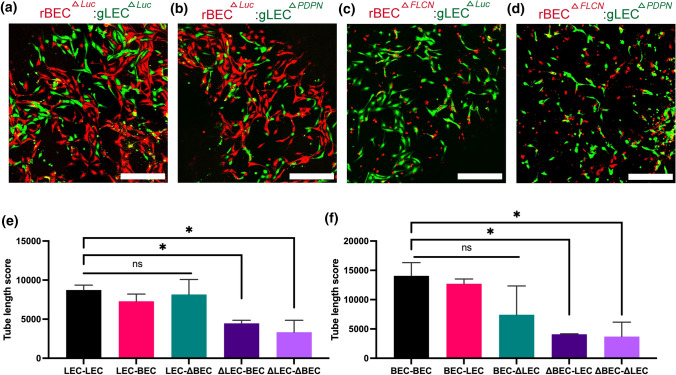
Figure 4.
The roles of FLCN and PDPN on cord-like networks formation. (a and b) Luciferase knockout BEC (rBEC ΔLuc) or (c and d) FLCN knockout BEC (rBECΔFLCN) stained in red are encapsulated in 3D fibrin gels together with (a and c) Luciferase knockout LEC (gLEC ΔLuc) or (b and d) PDPN knockout LEC (rLECΔPDPN) stained in green. Representative images of CLS formation were imaged at 48 h. Scale bars are 500 μm. (e and f) CLS formed on 3D fibrin gel was quantified for tube length using AutoTube. Data represents mean SD, n = 4 per group, n.s. p > 0.05, *p < 0.05. All p values were determined by ANOVA followed by post hoc testing with Tukey analysis.

