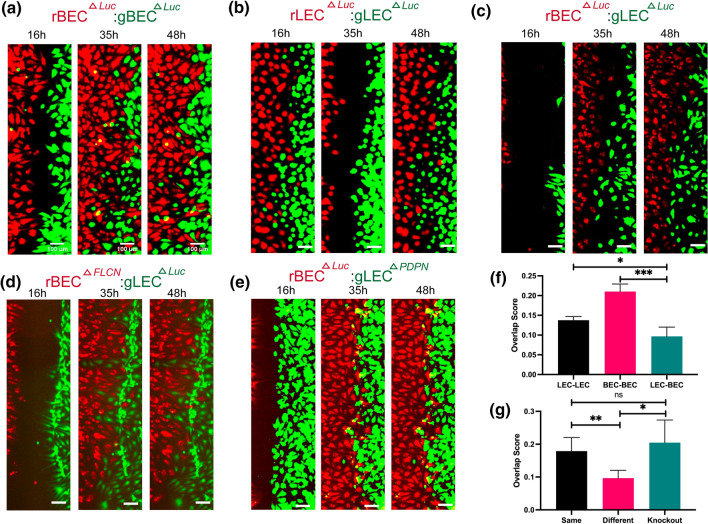
Figure 5.
The roles of FLCN and PDPN on cell migration. Representative images of the wound healing assay taken at t = 16, 35, and 48 h for (a) BEC ΔLuc (in red): BEC ΔLuc (in green), (b) LEC ΔLuc (in red): LEC ΔLuc (in green), (c) BEC ΔLuc (in red): LEC ΔLuc (in green), (d) BECΔFLCN (in red): LEC ΔLuc (in green), and (e) BECΔLuc (in red): LEC ΔPDPN (in green). Each well was seeded with 7000 cells and allowed to settle for 24 h, then imaged for up to 48 h. Scale bars are 500 μm. Overlap scores for (f) wild-type BEC and LEC, as well as (g) knock-out BEC and LEC. The LEC-BEC condition consists of 4 replicates and the same and knockout conditions consist of 4 replicates from either of the two conditions. Data represents mean SD, n = 4 per group, n.s. p > 0.05, *p < 0.05, **p < 0.01, and ***p < 0.001. All p values were determined by ANOVA followed by post hoc testing with Tukey analysis.

