Fig. 3.
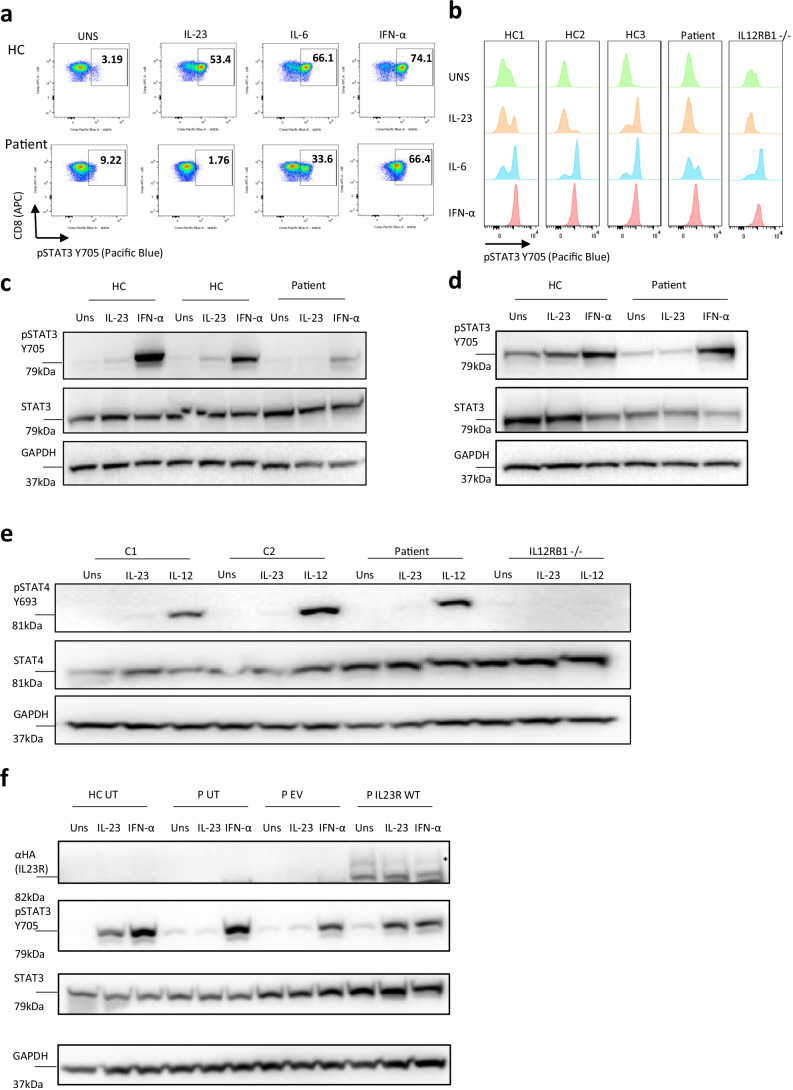
Impaired STAT3 but preserved STAT 4 phosphorylation responses in patient EBV-B cells and PBMCs. a FACS plot of 1 HC and patient for pSTAT3 on CD8 + T cells after IL-23 (100 ng/mL), IL-6 (10 ng/mL) or IFN-α (10 ng/mL) stimulation for 60 min. FMO pSTAT3 was used for proper gating. Representative of 2 independent experiments b pSTAT3 histograms from 3 HCs, patient and an IL12RB1 -/- patient, representative of 2 independent experiments c Western blot on EBV-B cells of 2 HC and patient for pSTAT3, stimulation as indicated in Fig. 3a. Representative of 3 independent experiments. d Western blot on PBMCs of 1 HC and patient for pSTAT3, stimulation as indicated in Fig. 3a. Representative of 3 independent experiments. e Western blot showing pSTAT4 after IL-23 (100 ng/mL) and IL-12 (40 ng/mL) stimulation of anti-CD3/CD28 pre-activated PBMCs from 2 HCs, patient and an IL12RB1 -/- patient. Data from 1 experiment. f pSTAT3 after lentiviral vector transduction of patient cells using stimulation as indicated in Fig. 3a, representative of n = 2 independent experiments. *N-glycosylated IL23R, UT = untransduced. EV = empty vector

