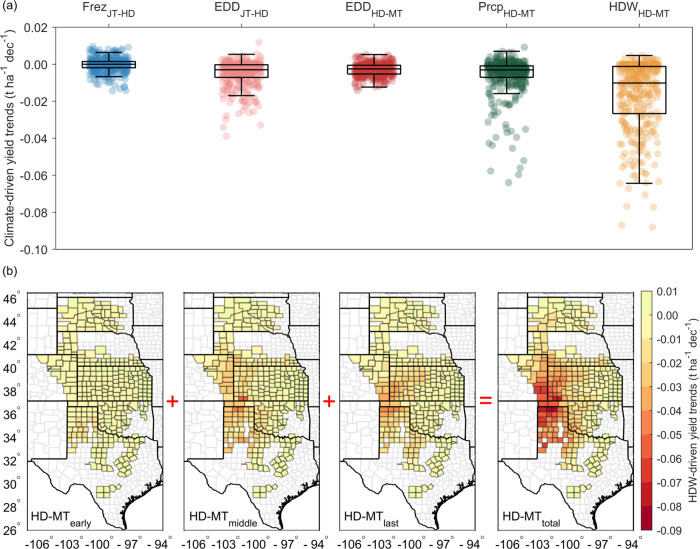
Fig. 3. Climate contributions to yield trends from 1982 to 2020.
a Yield trends associated with freezing days (Frez) and extreme degree days (EDD) during the jointing (JT) to heading (HD) stages, and with the EDD, precipitation (Prcp), and hot-dry-windy (HDW) during the heading (HD) to maturity (MT) stages. Box plots indicate median (middle line), 25th, 75th percentile (box) and 5th and 95th percentile (whiskers). Each dot represents individual county-level climate-driven yield trends. b The spatial distribution of HDW-driven yield trends during early, middle, and last sub-stages of HD-MT stage and total HD-MT stage.

