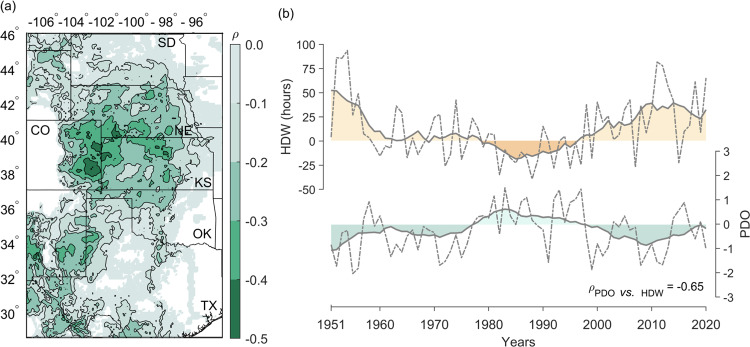
Fig. 4. The partial Spearman’s rank correlation coefficient between Pacific Decadal Oscillation (PDO) and hot-dry-windy (HDW) anomalies (after detrended) during April-June from 1951 to 2020 in our study domains including South Dakota (SD), Nebraska (NE), Colorado (CO), Kansas (KS), Oklahoma (OK), and Texas (TX).
a The spatial correlation coefficient between PDO and HDW anomalies where the temperature effect was controlled. b Time series of both PDO and HDW detrended anomalies. The HDW anomaly time series was averaged from the region with above the 95th percentile of annual averaged HDW (Fig. 1a). Dashed lines represent the raw anomaly (base period for anomaly: 1981–2010) and solid lines with shadowed areas represent the smoothed time series. The smoothing was conducted by a 9-year moving average. ρ refers to correlation coefficient.

