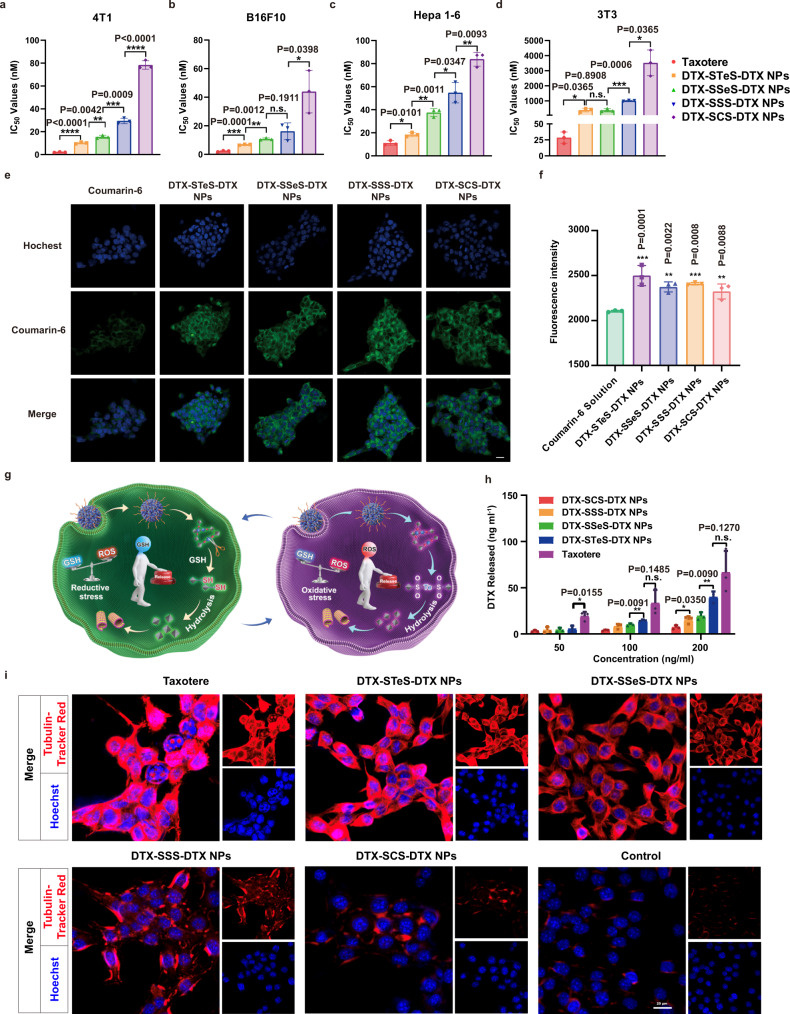
Fig. 5. Cytotoxicity and intracellular bioactivation.
a–d IC50 values of Taxotere and HPNAs in 4T1 cells, B16F10 cells, Hepa 1–6 cells, and 3T3 cells. All data are presented as mean ± SD (n = 3 independent experiments). n.s. (no significance) P > 0.05, *P < 0.05, **P < 0.01, ***P < 0.001 and ****P < 0.0001 by two-tailed Student’s t-test. Source data are provided as a Source Data file. e Cellular uptake of free coumarin-6 or coumarin-6-labeled HPNAs at 2 h. Scale bar represents 10 μm. Experiment was repeated twice independently with similar results. f Results of cell uptake by flow cytometry. Data are presented as mean ± SD (n = 3 independent experiments). One-way ANOVA (one-sided) with Dunnett’s multiple comparisons test was used for the analysis of data and adjusted P-value. Source data are provided as a Source Data file. g Illustration of intracellular drug release. h Free DTX released from HPNAs after incubation with 4T1 cells for 72 h. Data are presented as mean ± SD (n = 3 independent experiments). n.s. (no significance) P > 0.05, *P < 0.05 and **P < 0.01 by two-tailed Student’s t-test. Source data are provided as a Source Data file. i Inhibitory effect of Taxotere and HPNAs on tubulin. Scale bar represents 20 μm. Experiment was repeated twice independently with similar results.

