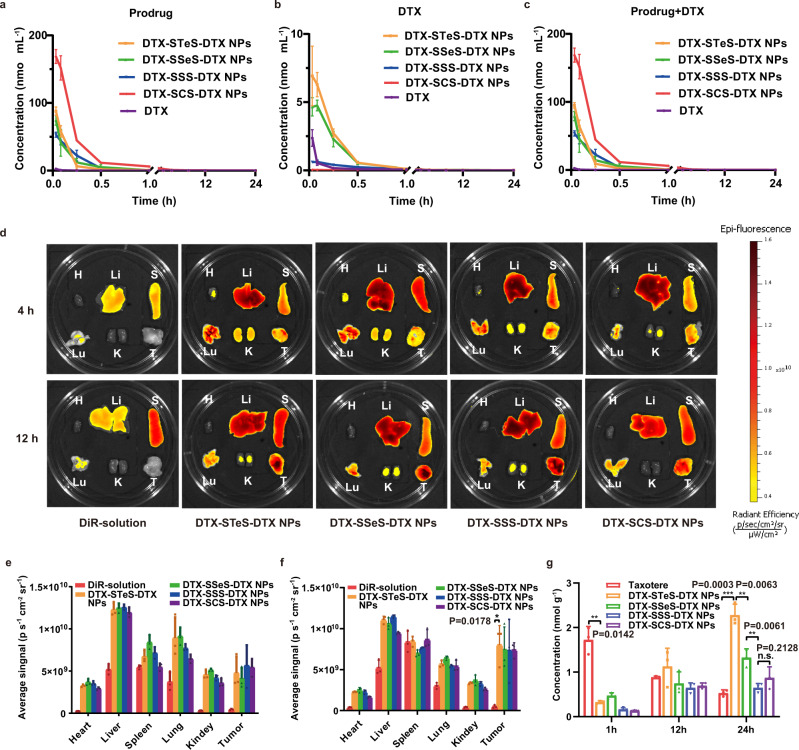
Fig. 6. Pharmacokinetics and biodistribution of HPNAs.
Pharmacokinetic profiles of the (a) prodrugs, (b) released DTX, and (c) total equivalent DTX. All data of a–c were presented as mean ± SD (n = 3 rats). Source data are provided as a Source Data file. d Biodistribution of DiR-solution or DiR-labeled HPNAs. Quantitative analysis of biodistribution at 4 h (e) and 12 h (f). g The accumulated DTX of Taxotere and HPNAs in tumor. All data of e–g were presented as mean ± SD (n = 3 mice). n.s (no significance) P > 0.05, *P < 0.05, **P < 0.01, and ***P < 0.001 by two-tailed Student’s t-test. Source data are provided as a Source Data file.

