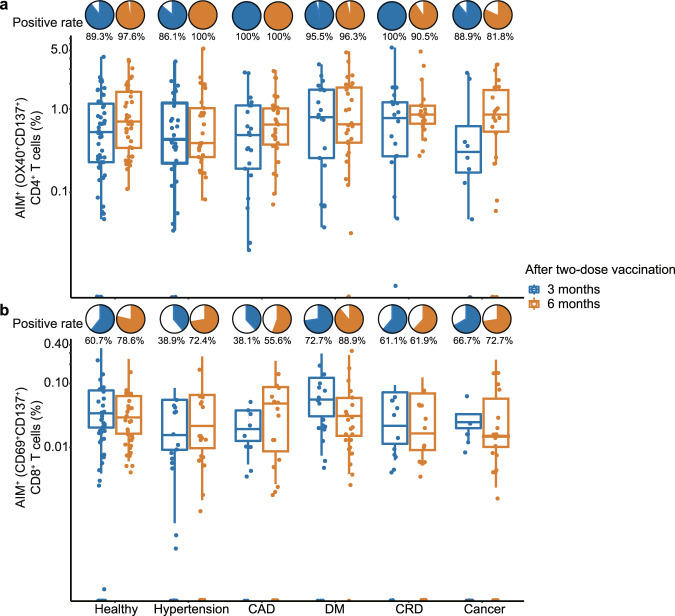
Fig. 4. The SARS-CoV-2-spesific T cell responses after 3 months, and 6 months after two-dose CoronaVac.
n = 229 study participants. Box indicates 25th, 50th, and 75th percentile absolute error, and whiskers indicate 5th and 95th percentile absolute error. Blue color refer to 3 months after two-dose vaccination, while orange color refer to 6 months. The detected positive rate and cell fraction of SARS-CoV-2-specific CD4+ T cell responses (OX40+ CD137+) (a) and the SARS-CoV-2-specific CD8+ T cell responses (CD69+ CD137+) (b) in different chronic diseases subgroups and healthy control, quantified by AIM assays.

