
Fig. 4. Molecular characteristics of Myc-R26Met and Alb-R26Met tumours.
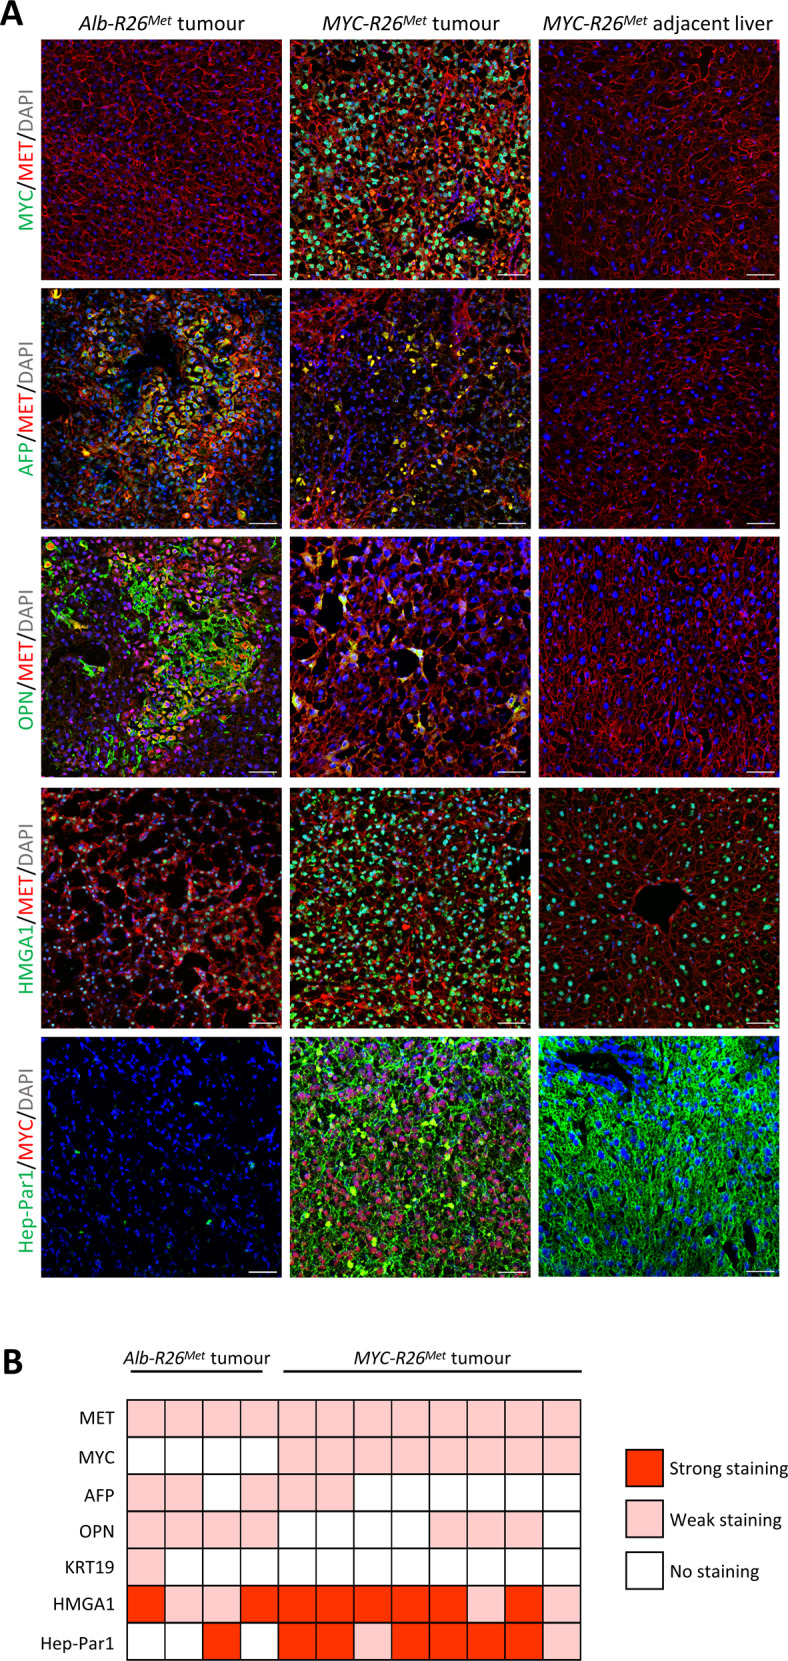
A Representative images of immunofluorescence staining of Myc-R26Met and Alb-R26Met tumour sections (and Myc-R26Met adjacent livers as controls), documenting the expression of MET, MYC, AFP, OPN, and EPCAM (scale bar: 50 µm). Nuclear staining in DAPI (blue). B Heatmap reporting the intensity of staining of immunofluorescence images for proteins reported on the left. Each square represents a distinct tumour sample.