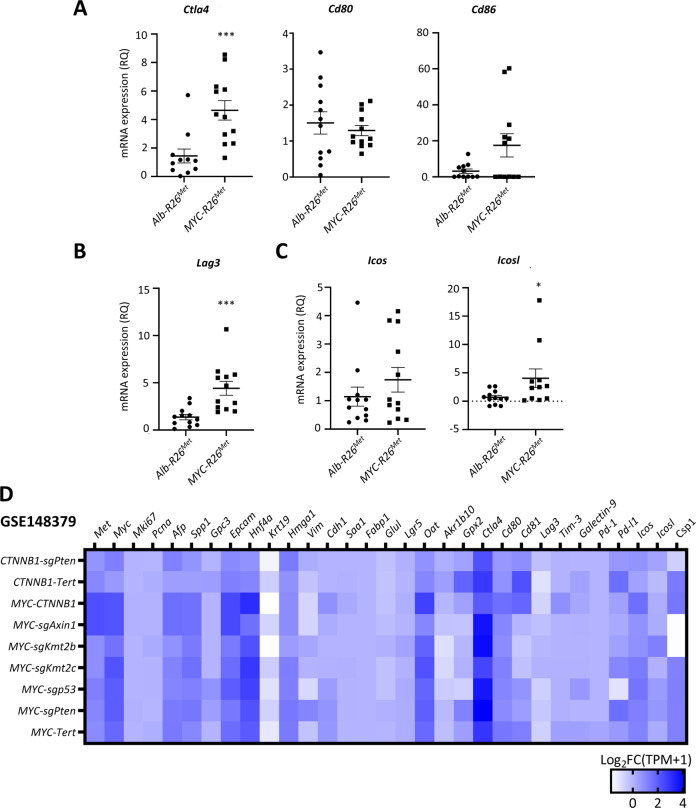
Fig. 5. MYC upregulation switches the immune-related molecular identity of HCC in MET cancer models.
A–C Graphs report the mRNA expression levels by RT-qPCR of the immune checkpoints Ctla4 and its ligands Cd80 and Cd81 (A), Lag3 (B), Icos and its ligand Icosl (C). D Heatmap representing the mRNA levels of genes of interest (indicated on the top) expressed as Log2FC (TPM + 1) in different tumours from murine HCC models obtained by hydrodynamically injecting plasmids to overexpress MYC in combination with different oncogenes (indicated on the left), compared with control livers. Results were extracted from a publicly available database with the GEO accession number GSE148379.

