
Fig. 5.
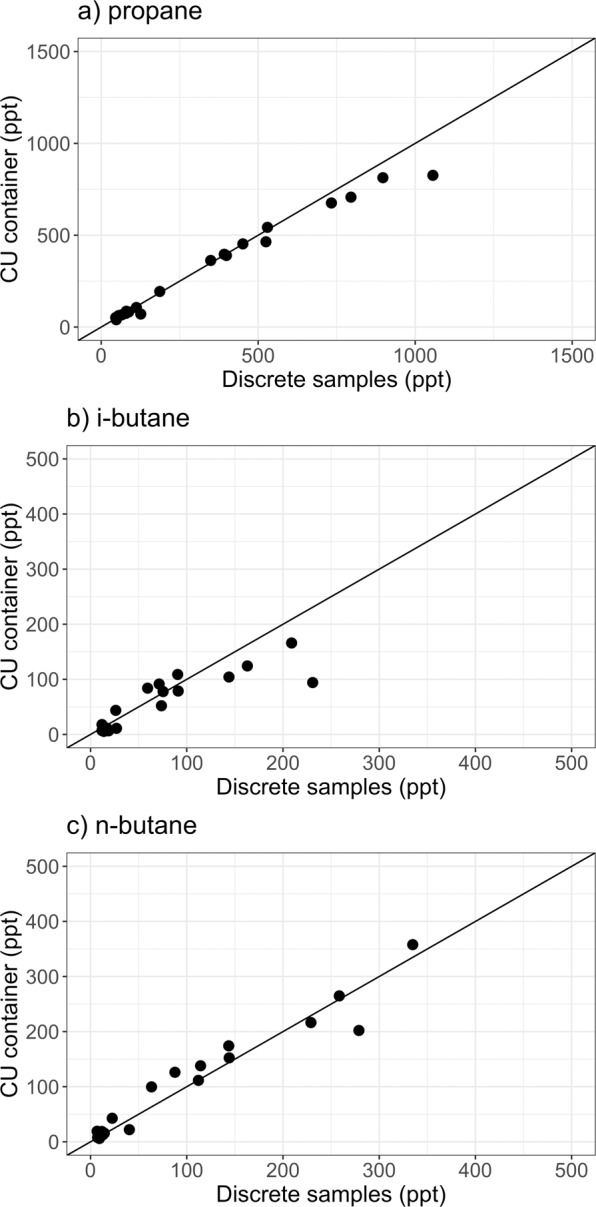
Comparison of redundant VOC measurements. Comparison of daily-averaged (a) propane, (b) i-butane, and (c) n-butane mole fractions measured in the University of Colorado (CU) container (y-axis) against atmospheric abundances inferred from discrete whole air sampling for post-cruise analysis at NOAA Global Monitoring Laboratory (x-axis). The black line is the bisector. Note that the CU VOC time series were not adjusted for calibration bias as we did not generate a merged VOC dataset.