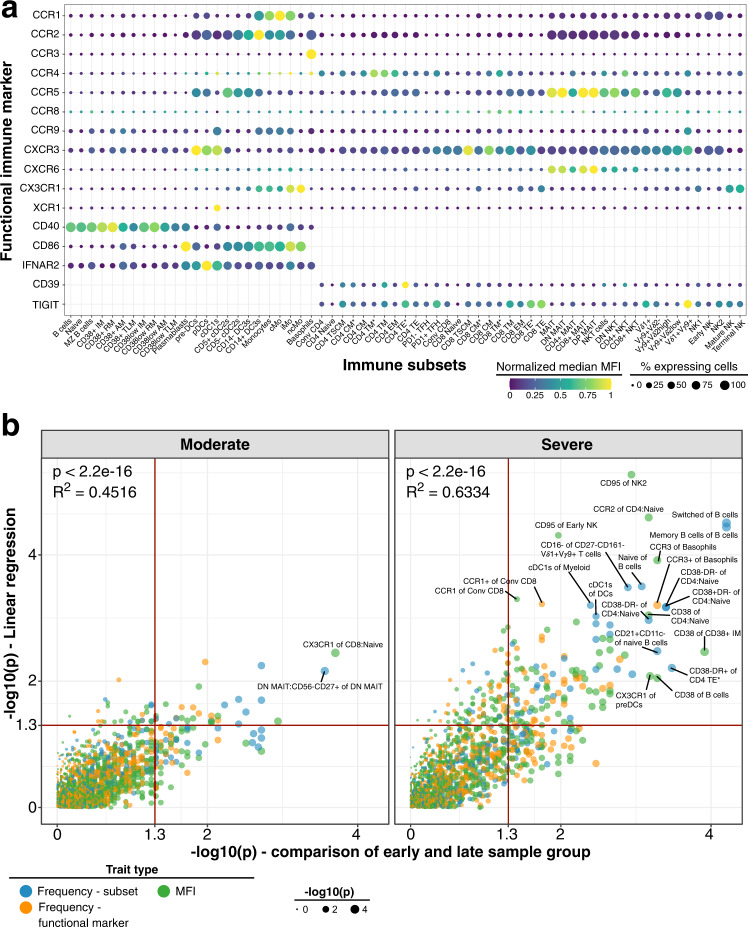
Fig. 1. Expression of functional markers and temporal dynamics of immune traits in COVID-19.
a Expression of chemokine receptors, CD40, CD86, IFNAR2, CD39 and TIGIT (rows) on immune cell populations (columns) is depicted. Median of mean fluorescence intensities (MFI) derived from 173 unexposed healthy individuals is visualized by min-max normalized color gradient. Dot size corresponds to median percentage of cells expressing these markers. Missing dots indicate that marker was not measured. b Immune traits (N = 1758) at baseline or affected by long-term perturbations were distinguished in individuals recovered from moderate (left) and severe (right) COVID-19 cases. A combination of (I) linear regression analysis between immune traits and days between symptom onset and sample collection and (II) comparison of samples collected before and after 60 days of symptom onset using a two-sided Wilcoxon test was used as described in Online methods. Plot shows unadjusted −log10 P-values from both analyses. Dot size increases with significance from Wilcoxon test. Trait types are colored (Frequency of immune subset in blue, Frequency of expressing functional marker in orange and MFI values in green). Red line highlights threshold for unadjusted significance (P = 0.05). Source data are provided as a Source Data file.

