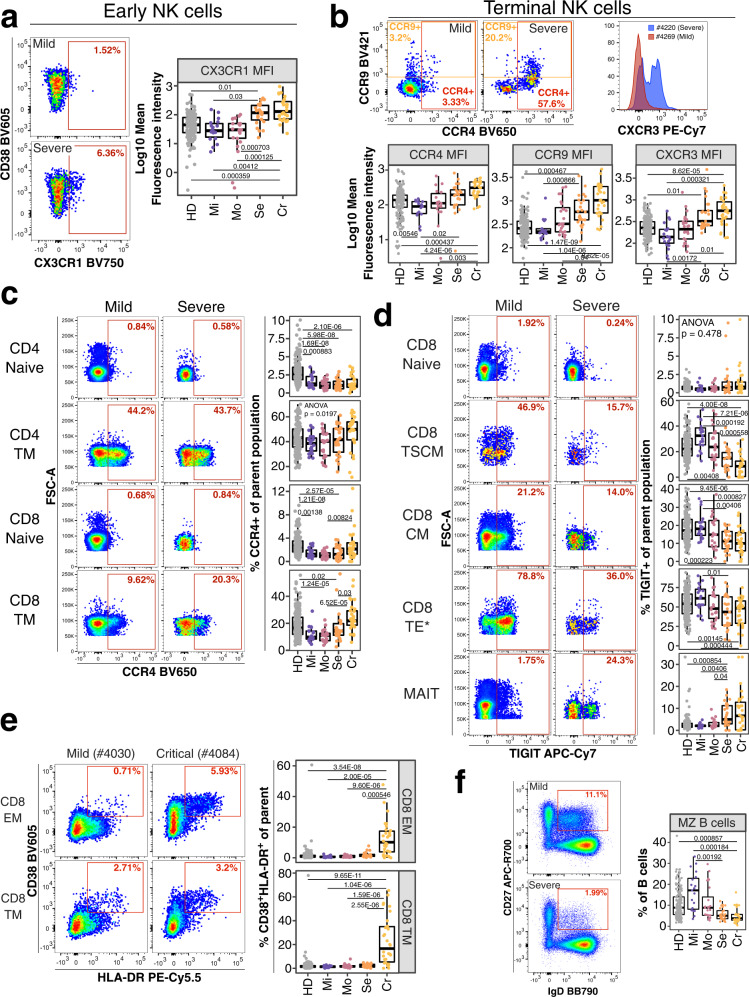
Fig. 3. Potential immune features at baseline predicting COVID-19 severity.
a Flow cytometry data (left) depicts CX3CR1 expression on early NK cells from an individual recovered from mild (top) and severe (bottom) COVID-19. Quantification of mean fluorescence intensity (MFI) of CX3CR1 on early NK cells is shown as boxplot for all study groups. b Flow cytometry dot plots on top row (left and middle plot) depicts expression of CCR4 and CCR9 for a mild and severe COVID-19 case. Histogram overlay shows CXCR3 expression for the same cell subset and donors. MFI values for the same receptors are shown as boxplots for all groups (bottom row). c Flow cytometry plot depicts expression of CCR4 on CD4+ naive (top row), CD4+ transitional memory (TM, second row), CD8+ naïve (third row) and CD8+ TM (bottom row) T cells from an individual recovered from mild (left column) or severe (right column) COVID-19. Quantification of these subsets in all study groups are shown as boxplots (right). d Flow cytometry plot depicts TIGIT expression on CD8+ naive (top row), CD8+ stem-cell like memory (TSCM, second row), CD8+ central memory (CM, third row), CD8+ terminal effector* (TE*, fourth row) T cells and MAIT cells (bottom row) from an individual recovered from mild (left column) and severe (right column) COVID-19. Quantification of these subsets in all study groups are shown as boxplots (right). e Flow cytometry data (left) depicts CD38 and HLA-DR expression on CD8 effector (EM; top) and terminal (TM; bottom) memory T cells from an individual recovered from mild (left) and critical (right) COVID-19. The gate defines CD38+HLA-DR+ activated T cells. Quantification of these subsets in all study groups are shown as boxplots (right). f Flow cytometry example data (left) for gating of marginal zone (MZ) B cells from total B cells in an individual recovered from mild and severe COVID-19 is shown. Boxplot (right) shows frequencies of MZ B cells of total B cells in all study groups. Residuals from linear regression between immune trait and age were used to calculate statistics on age-corrected data. ANOVA with subsequent two-sided Wilcoxon test and Bonferroni correction on residuals was performed for statistics highlighted in boxplots. Boxplots depict median and interquartile range (IQR) and length of whiskers is 1.5 times IQR. Study groups encompass healthy unexposed controls (HD) and individuals recovered from mild (Mi), moderate (Mo), severe (Se) and critical (Cr) COVID-19. Source data are provided as a Source Data file.

