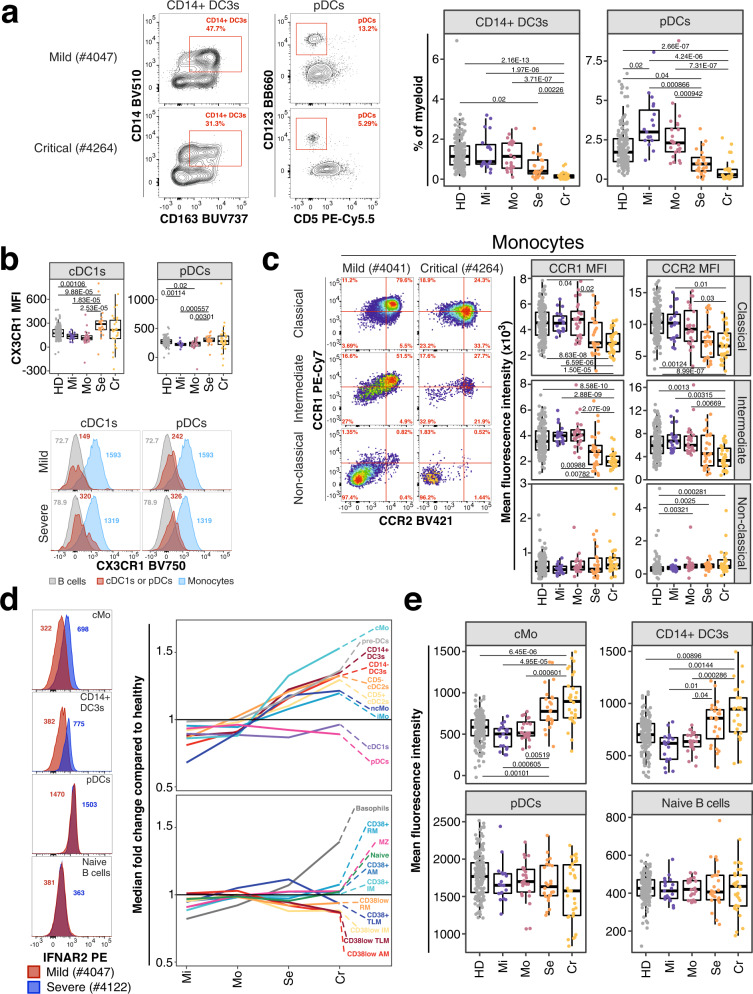
Fig. 4. Innate immune signatures predict COVID-19 severity.
a Example flow cytometry data for frequencies of pDCs from dendritic cells and inflammatory CD14+ DC3s of total DC3s is shown from an individual recovered from mild (top) and critical (bottom) COVID-19. Corresponding enumeration for all donors based on study group and as percentage of total myeloid cells are shown as boxplots (right). Precise delineation of pDCs is shown in Supplementary Fig. 1c. b Mean fluorescence intensity (MFI) of CX3CR1 on cDC1s (left) and pDCs (right) is shown for all study groups as boxplot (top row). Example flow cytometry data for CX3CR1 signal (red peak) on cDC1s (first column) and pDCs (second column) is shown as histogram for an individual recovered from mild (top row) and severe (bottom row) COVID-19. B cells (gray) and Monocytes (blue) are overlaid as reference populations known to lack and express CX3CR1, respectively. Numbers in histogram plots highlight MFI. c Flow cytometry data (left) depicts CCR1 and CCR2 expression on classical (top), intermediate (middle) and non-classical (bottom) monocytes from a patient recovered from mild (left column) and critical (right column) COVID-19. Boxplots (right) show MFI values of CCR1 (first column) and CCR2 (second column) on the same monocyte populations for all study groups. d Expression of IFNAR2 from an individual recovered from mild (red) and severe (blue) COVID-19 is shown as overlaid histogram (left) for classical monocytes (top), CD14+ DC3s (second row), pDCs (third row) and naive B cells (bottom). Plot on the right depicts fold change of median IFNAR2 expression of each disease severity group compared to median IFNAR2 expression of unexposed healthy individuals on all defined myeloid (top) and non-myeloid (bottom) subsets. e Boxplots show IFNAR2 MFI for all study groups for classical monocytes, CD14 + DC3s, pDCs and naïve B cells. Residuals from linear regression between immune trait and age were used to calculate statistics on age-corrected data. ANOVA with subsequent two-sided Wilcoxon test and Bonferroni correction on residuals was performed for statistics highlighted in boxplots. Boxplots depict median and interquartile range (IQR) and length of whiskers is 1.5 times IQR. Study groups encompass healthy unexposed controls (HD) and individuals recovered from mild (Mi), moderate (Mo), severe (Se) and critical (Cr) COVID-19. Source data are provided as a Source Data file.

