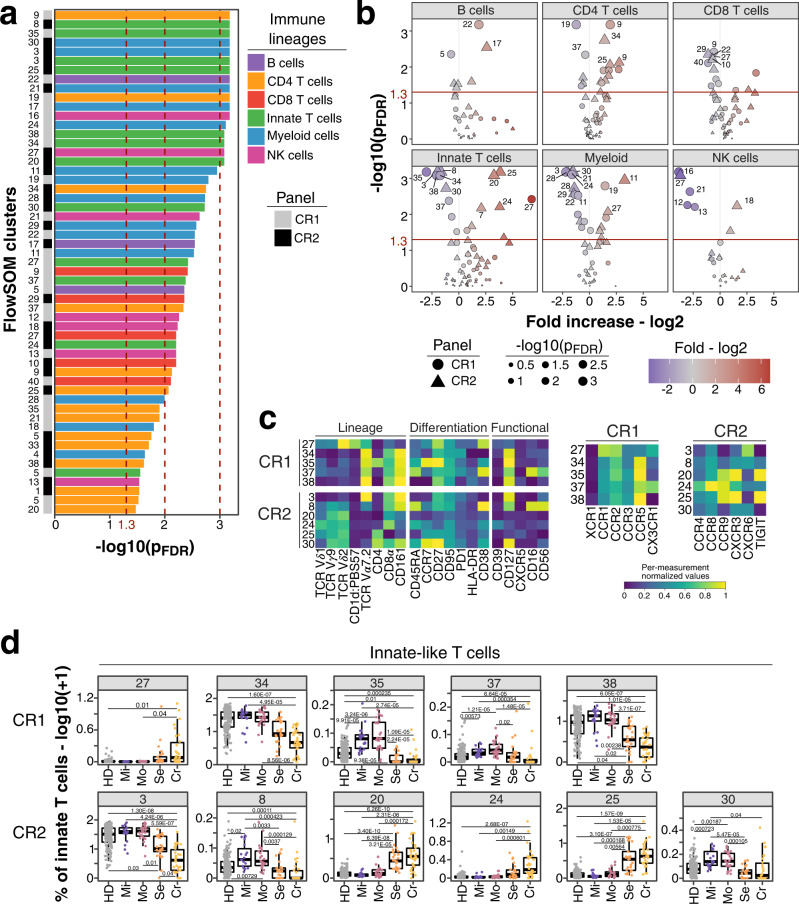
Fig. 5. Unsupervised analysis of immune system in individuals recovered from non-severe and severe COVID-19.
a FDR-adjusted −log10 P-values of FlowSOM clusters (N = 55) which differ significantly (P < 0.05) between individuals recovered from non-severe (mild/moderate) and severe (severe/critical) COVID-19 are shown. Bars are colored based on lineage (B cells, purple; CD4 T cells, orange; CD8 T cells, red; innate-like T cells, green; myeloid cells, blue; NK cells, pink). Bar on the left indicates whether traits originate from chemokine receptor panel 1 (CR1, gray) or 2 (CR2, black). b Volcano plots show FDR-adjusted −log10 P-values and log2 fold change derived from comparison of FlowSOM clusters between individuals recovered from non-severe and severe COVID-19 cases. Main lineages are depicted in separated plots and contain FlowSOM clusters from both panels CR1 (circle) and CR2 (triangle). Data point size corresponds to −log10 P-values and color indicates log2 fold change. P-values from Fig. 5a and b derive from logistic regression analysis with correction for age and experiment batch. P-values were corrected for multiple testing using Benjamini-Hochberg false discovery rate. c Heatmap depicts normalized median fluorescence intensity (MFI) values for lineage, differentiation and functional markers from top significant innate-like T cell clusters (Fig. 5a, P < 0.01). Values derived from CR1 (top) and CR2 (bottom) panels are separated. Heatmaps on the right highlight expression of markers specific for CR1 and CR2 panels including chemokine receptors, co-stimulatory markers and IFNAR2. Values are normalized based on trimmed 1–99% percentile values. Complete heatmaps for all innate-like T cell clusters are shown in Supplementary Fig. 12a, b. d Frequencies for same clusters described in Fig. 5c are shown as boxplots based on study group. Values are log10(+1) transformed and plotted on linear scale. Logistic regression with correction for age and experiment batch was used to identify significant clusters between non-severe and severe COVID-19. Only FlowSOM clusters (N = 291) which did not show temporal changes within moderate and severe COVID-19 cases are shown as described in the Online methods section and results (Supplementary Fig. 13a). Residuals from linear regression between immune trait and age were used to calculate statistics on age-corrected data. ANOVA with subsequent Wilcoxon test and Bonferroni correction on residuals was performed for statistics highlighted in boxplots. Boxplots depict median and interquartile range (IQR) and length of whiskers is 1.5 times IQR. Study groups encompass healthy unexposed controls (HD) and individuals recovered from mild (Mi), moderate (Mo), severe (Se) and critical (Cr) COVID-19. Source data are provided as a Source Data file.

