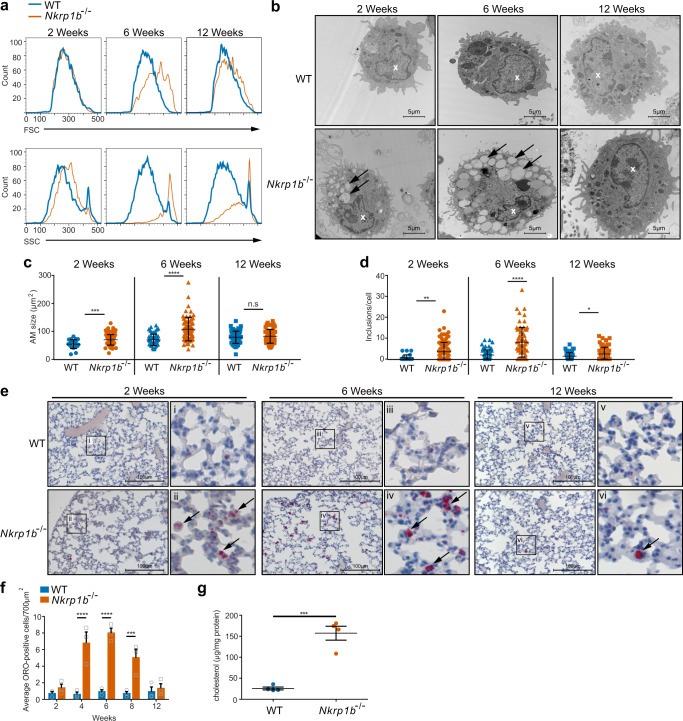
Fig. 3. Nkrp1b−/− AM accumulate intracellular lipids over time.
a FSC and SSC profiles of AM isolated from WT and Nkrp1b−/− mice at 2, 6, and 12 weeks of age. b Images of AM as seen by TEM isolated from WT and Nkrp1b−/− mice at 2, 6, and 12 weeks of age. Images are representative of three independent experiments. Inclusions are highlighted by arrows; the nucleus is highlighted with a white “x”. c and d Quantifications of AM surface area and a number of electron-poor inclusions, respectively, as seen by TEM. AM isolated from mice aged 2, 6, and 12 weeks. Data presented as mean ± SEM. Statistics in c and d were determined by an unpaired, two-tailed Student’s t-test where *p < 0.05, **p < 0.01, ***p < 0.001, and ****p < 0.0001. n = 3 with 55 AM examined per experiment. e Lung sections stained with ORO obtained from WT and Nkrp1b−/− mice 2, 6, and 12 weeks of age at ×20 magnification. Boxed areas (i–vi) within each image are shown in magnified panels to the right. Arrows indicate ORO-positive staining. Images are representative of three independent experiments. f Quantifications of ORO-positive cells/700 μm2 in frozen lung sections stained with ORO obtained from WT and Nkrp1b−/− mice at 2, 4, 6, 8, and 12 weeks of age. For WT and Nkrp1b−/− n = 3 mice per age. Data presented as mean ± SEM. g Cholesterol content of WT and Nkrp1b−/− lavaged AM as determined by amplex-red assays. Data presented as mean ± SEM. n = 4 WT and Nkrp1b−/− mice. Statistics were determined by an unpaired, two-tailed Student’s t-test where ***p < 0.001. All graphs and histograms indicate WT in blue and Nkrp1b−/− in orange. Source data are provided as a Source Data file.

