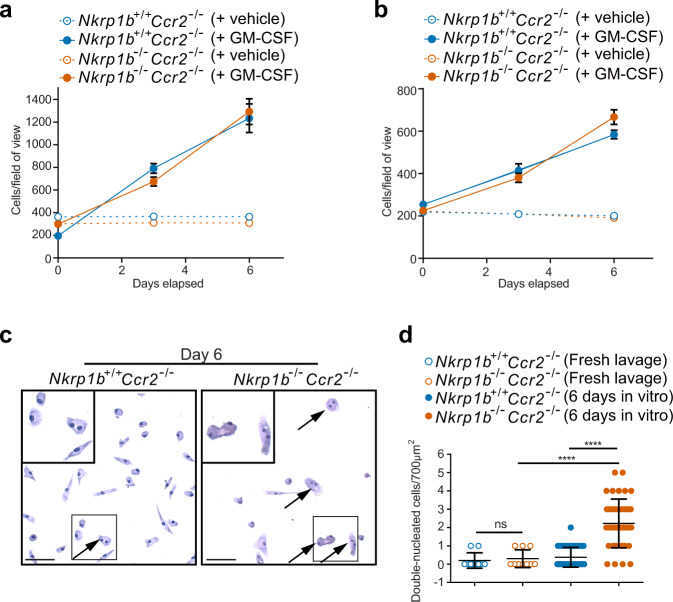
Fig. 4. Nkrp1b−/− AM show signs of cell cycle deficiency in vivo, but not in vitro.
a and b Quantification of a number of visible cells per field of view taken from Nkrp1b+/+Ccr2−/− and Nkrp1b−/−Ccr2−/− mice at 2 and 6 weeks of age, respectively (n = 4 mice per treatment group of each age). Cell numbers were quantified on days 0, 3, and 6 post-plating. Data presented as mean ± SEM. c Images of AM isolated from Nkrp1b+/+Ccr2−/− and Nkrp1b−/−Ccr2−/− mice after being kept in vitro for 6 days and stained with hematoxylin. Nkrp1b−/−Ccr2−/− frame highlighting double nucleated cells (arrows). Select cells within inset boxes are shown magnified in the top left corner. Images are representative of three independent experiments. 50 μm scale bars are shown. d Quantifications of double-nucleated cells as seen in c from freshly lavaged AM from Nkrp1b+/+Ccr2−/− and Nkrp1b−/−Ccr2−/− (n = 2 mice per genotype) or AM lavaged from Nkrp1b+/+Ccr2−/− and Nkrp1b−/−Ccr2−/− and kept in vitro for 6 days (n = 4 mice per genotype). Data presented as mean ± SEM. Statistics were determined by an unpaired, two-tailed Student’s t-test where ****p < 0.0001. In all graphs, Nkrp1b+/+ is indicated in blue and Nkrp1b−/− in orange. Source data are provided as a Source Data file.

