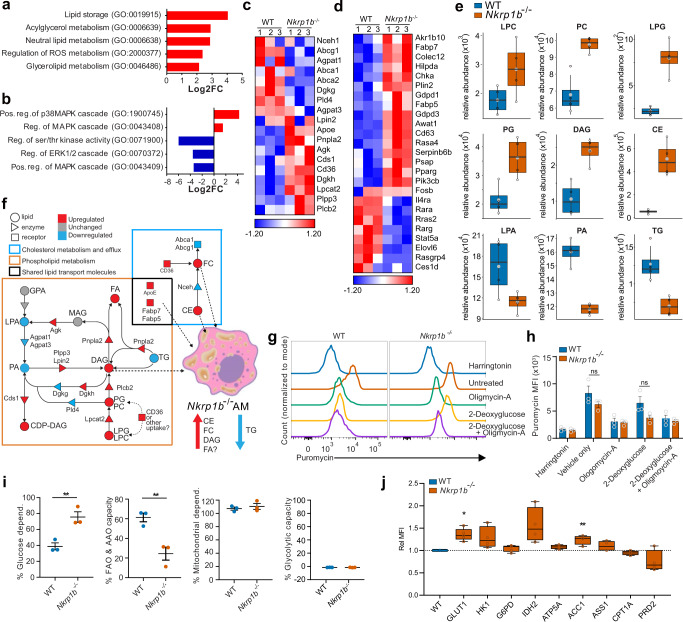
Fig. 5. RNA-Seq and lipidomics indicate a dysregulation of metabolism in Nkrp1b−/− AM.
a and b Gene ontology pathways enriched (Log2 fold change) in Nkrp1b−/− AM from 2-week-old mice as determined by RNA-Seq analysis. c and d Heatmaps of select lipid metabolic and general metabolic genes in AM. Log2 fold change enrichment presented as Z-scores (n = 3 replicates) for WT and Nkrp1b−/− with a pool of five mice for every replicate. e Comparison between the abundance of an indicated lipid species and internal lipid standards from lipidomic analysis of AM from 6-week-old WT and Nkrp1b−/− mice (n = 4 independent experiments per genotype). LPC (Lysophosphatidylcholine), PC (Phosphatidylcholine), LPG (Lysophosphatidylglycerol), PG (Phosphatidylglycerol), DAG (Diacylglyceride), CE (Cholesterol ester), LPA (Lysophosphatidic acid), PA (Phosphatidic acid), TG (Triglyceride). Boxplots indicate median, IQR, maximum, and minimum bars. Large and small data points represent average SD and individual experimental replicates, respectively. f Model combining RNA-seq (c) and lipidomics (e) data showing increased (red) or decreased (blue) lipid species and enzyme/receptor expression in Nkrp1b−/− AM. Dashed arrows indicate lipid shuttling into droplets. g Representative histograms of puromycin incorporation into WT and Nkrp1b−/− AM from 2-week-old mice exposed to Harringtonin, Vehicle/untreated control, Oligomycin-A, 2-Deoxyglucose, 2-Deoxyglucose + Oligomycin-A (n = 3 independent experiments). h MFI quantification of puromycin incorporation into AM as shown in (g). Data presented as mean ± SEM, each data point represents an independent experiment of 3 mice of each genotype pooled. Statistics represent two-way ANOVA with Sidak’s correction (n = 3). i Percent glucose dependence and FAO/AAO capacity in WT and Nkrp1b−/− AM derived from MFIs in (h) (n = 3 independent experiments). See methods for equations. Data presented as mean ± SEM. Statistics in i represent unpaired, two-tailed Student’s t-test; *p < 0.05 and **p < 0.01. j Relative MFI of stained metabolic proteins in WT and Nkrp1b−/− AM (n = 4 mice per genotype per stain). Boxplots indicate mean, IQR, and data minimum and maximum whiskers. Statistics represent unpaired, two-tailed Student’s t-test of data prior to normalization; *p < 0.05 and **p < 0.01. Source data are provided as a Source Data file.

