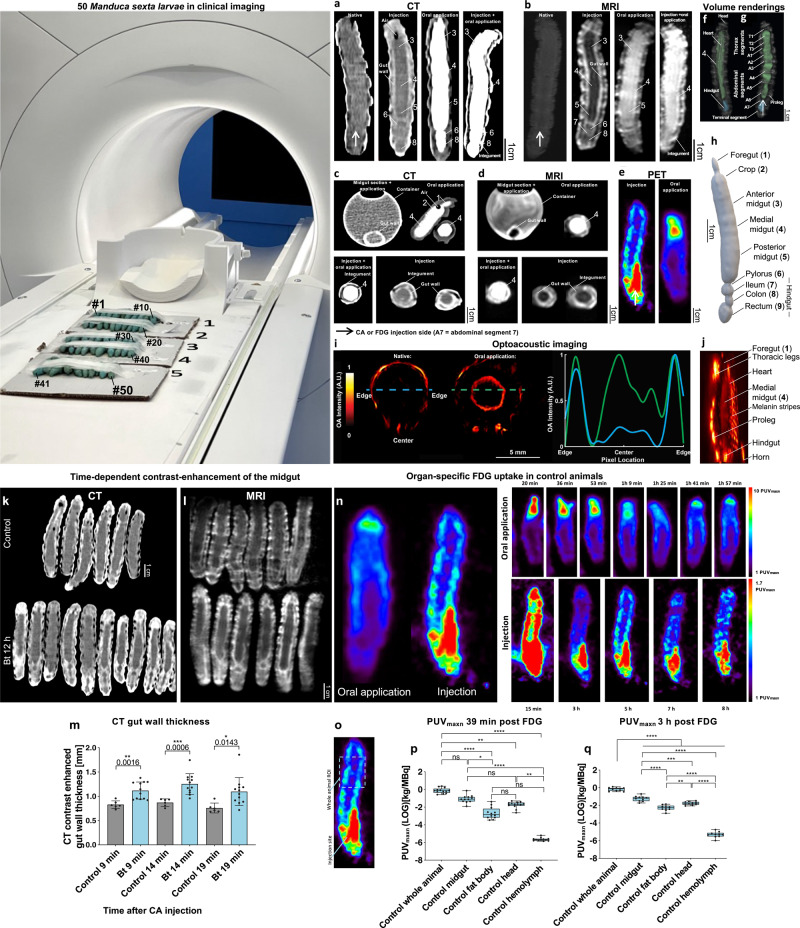
Fig. 1. Experimental setup and validation of multimodal imaging of Manduca sexta larvae.
50 Manduca sexta larvae were imaged in a clinical MR scanner. The midgut of the M. sexta larvae was imaged by CT (a, c, h), MRI (b, d, f, g), PET (e), and OAT (i and j: Experiments were repeated independently: n = 4 with similar results) with or without the injection and/or oral application of a contrast agent (CA). Axial image of the isolated midgut of M. sexta exposed to CA washed out with 0.9% NaCl (c and d, midgut section + application). Volume rendering of the alimentary tract of M. sexta obtained from MRI (f, g) after injection of Gd-BOPTA, or CT (h Experiments were repeated independently: n = 30 with similar results) after oral application of iodixanol. Time-dependent contrast-enhancement of the midgut after injection of CA in animals 12 h after Bt infection. k, l Coronal CT and MR images of control and Bt-infected animals after the injection of CA. m CT contrast-enhanced gut wall thickness of control and Bt-infected animals 12 h after Bt infection at 9 min, 14 min, and 19 min after CA injection. The most significant difference between control and Bt infected animals was 14 min after CA injection, n = 18, two-tailed t-test. n FDG-PET images after oral application or intracardial injections and time-dependent uptake of FDG. o Area of PUVmaxn determination. Organ-specific FDG uptake in control animals. PUVmaxn values of whole larvae and isolated organs after (p) 39 min and (n = 63, Kruskal-Wallis-test = 55.1 4, P= < 0.0001, box plots: 25th–75th percentiles, whiskers: min-max (show all points), center: median) (q) 3 h (n = 50, one-way ANOVA, F(4,45) = 501.0, R2 = 0.978, P < 0.0001, box plots: 25th–75th percentiles, whiskers: min–max (show all points), center: median) of FDG application are shown. The following significance levels have been used: ns = P > 0.05, * = P ≤ 0.05, ** P ≤ 0.01, *** = P ≤ 0.001 and **** = P ≤ 0.0001. Bar charts represent mean and SD. Every data point represents a single animal. Source data are provided as a Source Data file.

