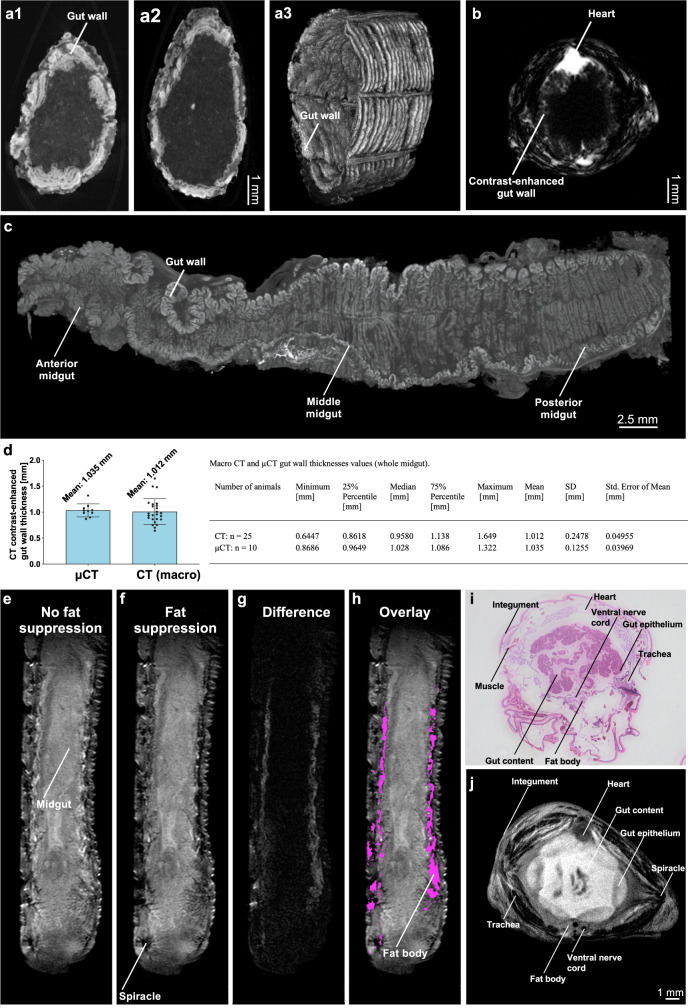
Fig. 2. High-resolution verification of in vivo measurements of multimodal imaging of M. sexta larvae.
a1–a3 Contrast-enhanced ex vivo µCT of two different anterior midgut regions (smaller diameter and larger diameter) and with a 3D volume rendering (Supplementary Video 5). b Axial in vivo μMRI of a M. sexta L5 larva 10 min after the injection of contrast agent (CA). The gut wall shows the strong uptake of CA. c PTA-stained midgut in µCT, d Mean CT (n = 25, voxel size of 350 µm) and µCT (n = 10, voxel size of 7.55 µm) gut wall thicknesses from the complete midgut with descriptive statistics. The fat body of M. sexta in μMRI with (f) and without (e) fat suppression. The difference between e and f is shown in g and corresponds to the fat body of M. sexta (h). i Shows an axial paraffin section (L5d2), which shows the fat body and confirms our analysis of e and f. j This shows a corresponding axial μMRI of an M. sexta (L5d5) larvae. Bar charts represent mean and SD. Every data point represents a single animal. Source data are provided as a Source Data file.

