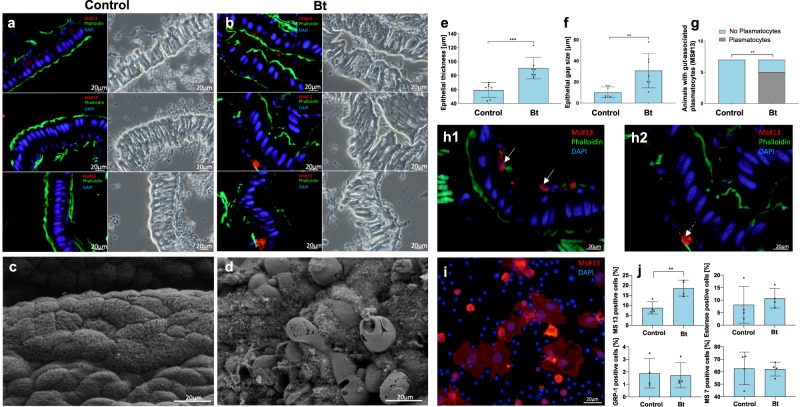
Fig. 3. Histopathological characterization of the colitis-like phenotype in larvae treated with Bacillus thuringiensis (Bt).
a, b Midgut histology (cryosections) from control (n = 7) and Bt-treated (n = 7) larvae. On the left are fluorescence microscopy (FM) images, on the right the corresponding phase-contrast microscopy (PCM) images. Bt-infected animals differed significantly in gut wall thickness (two-tailed Mann Whitney test, p = 0.0006, no adjustments, e and gap size (two-tailed Mann Whitney test, p = 0.0041, no adjustments f and had gut-associated plasmatocytes (red, monoclonal antibody Ms#13) (two-sided Chi-square-test, P = 0.0053, g). h1 and h2 are showing the gut-associated plasmatocytes from Bt-treated animals, indicated by arrows. F-actin is stained with FITC-phalloidin (green), indicating microvilli on the apical side of the epithelium. Nuclei are counterstained with DAPI (blue). c, d Midgut ultrastructure (scanning electron microscopy) from control (n = 5) and Bt-treated (n = 3) larvae. Bt-exposed larvae showed loss of microvilli, cell swelling, and necrosis. i Changes in differential hemocyte count 12 h after Bt infection. Plasmatocytes were labeled with antibody MS#13 (red) and the nuclei of all hemocytes are counterstained with DAPI (blue). j Animals infected with Bt (n = 4) featured a significantly higher number of floating plasmatocytes than control animals (n = 4), indicating a change in the cellular immune response (two-tailed t-test, p = 0.0076, no adjustments). No changes were observed in spherule cells (esterase positive), oenocytoids (GRP-1 positive), or granular cells (MS#7 positive). The following significance levels have been used: ns = P > 0.05, * = P ≤ 0.05, ** P ≤ 0.01, *** = P ≤ 0.001 and **** = P ≤ 0.0001. Bar charts represent mean and SD. Every data point represents a single animal. Source data are provided as a Source Data file.

