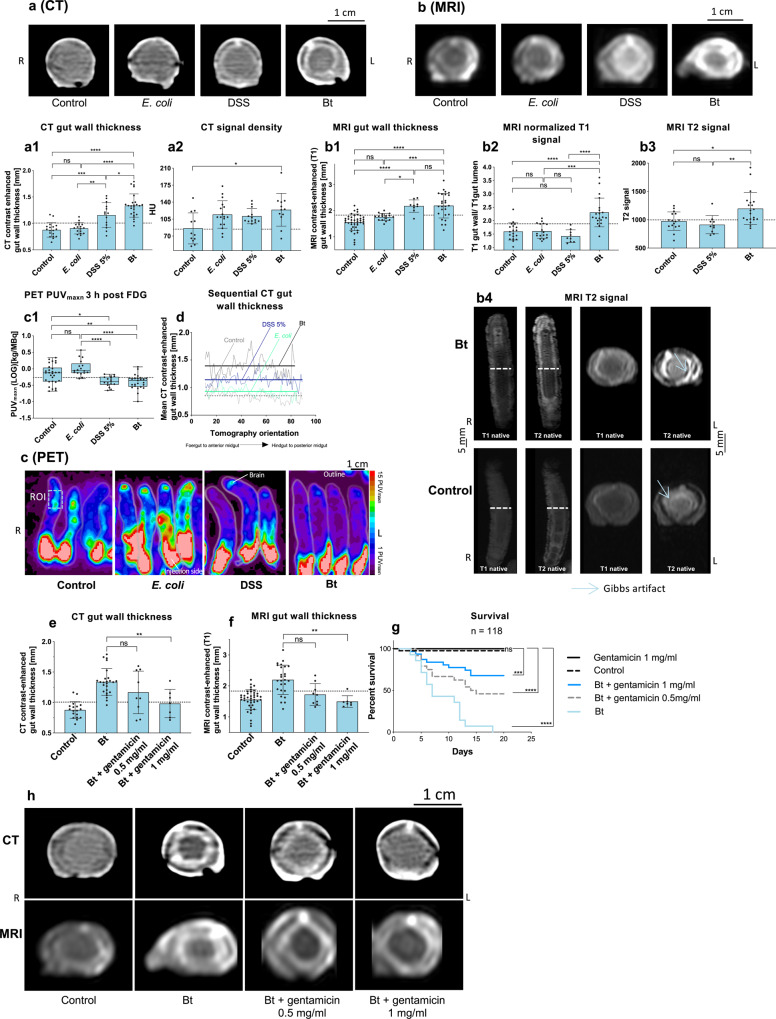
Fig. 4. High-throughput imaging of larvae exposed to different challenges and concentration-dependent rescue of the colitis-like phenotype with gentamicin.
M. sexta larvae shown in axial CT (a), MRI (b), and PET (c). Animals were fed with a control diet or a diet containing Escherichia coli, DSS, or Bacillus thuringiensis (Bt). a1–c1 Quantification of the imaging data, a1: n = 75, one-way ANOVA, F(3,71) = 30.23, R2 = 0.5609, P < 0.0001, a2: n = 54, Kruskal-Wallis-test = 9.954, P = 0.019, b1: n = 92, one-way ANOVA, F(3,88) = 21.72, R2 = 0.4255, P < 0.0001, b2: n = 65, Kruskal-Wallis test = 31.74, P < 0.0001, b3: n = 46, Kruskal-Wallis test = 13.58, P = 0.0011 and c1: n = 88, one-way ANOVA, F(3,84) = 13.15, R2 = 0.3196, box plots: 25th–75th percentiles, whiskers: min–max (show all points), center: median. d Mean sequential CT gut wall thickness curves (the horizontal lines represent the overall treatment-specific mean thickness, preferred model: different curve for each data set, F(3, 301) = 391, P < 0.0001). Contrast-enhanced CT and MRI gut wall thickness showed a gentamicin concentration-dependent reduction of gut wall thickness in animals fed with Bt and two different gentamicin concentrations (e): n = 59, one-way ANOVA, F(3,55) = 15.83, R2 = 0.4634, P < 0.0001, (f): n = 83, Kruskal-Wallis-test = 28.07, P < 0.0001. This finding was also confirmed by the differential survival of the treated animals (g). Dashed lines indicate threshold values. Significance levels: ns = P > 0.05, *P ≤ 0.05, **P ≤ 0.01, ***P ≤ 0.001 and ****P ≤ 0.0001. Survival kinetics shows the sum of the conducted experiments. Bar charts represent mean and SD. Every data point represents a single animal. Source data are provided as a Source Data file.

