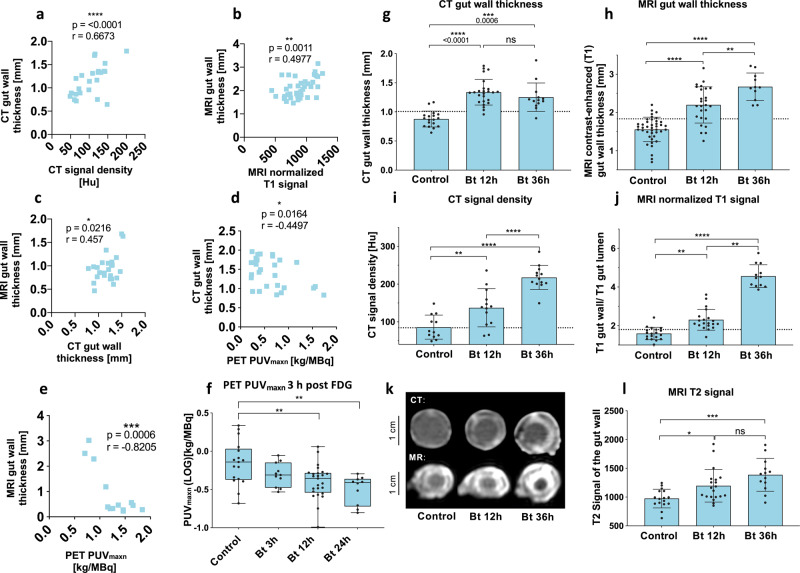
Fig. 5. Correlations of diagnostic findings and temporal development of the colitis-like phenotype in M. sexta.
Correlations (Pearson) of the used diagnostic findings with each other. (a) Relationships between the two CT features (maximum CT-contrast-enhanced gut wall thickness and maximum signal density of the gut wall, n = 32, r = 0.6673, 95% CI = 0.4153–0.8242, r2 = 0.4453 and two-tailed P < 0.0001). b Correlations between two MRI features (MRI-contrast-enhanced gut wall thickness and normalized T1 signal, n = 40, r = 0.4977, 95% CI = 0.2204–0.7006, r2 = 0.2477 and two-tailed P = 0.0011). c Correlations between the CT feature (CT-contrast-enhanced gut wall thickness) and the MRI feature (MRI-contrast-enhanced gut wall thickness), n = 25, r = 0.457, 95% CI = 0.07551–0.7218, r2 = 0.2089 and two-tailed P = 0.0216. d Correlations between the CT feature (CT-contrast-enhanced gut wall thickness) and the PET feature (PUVmaxn), n = 28, r = −0.4497, 95% CI = −0.7046 to −0.0924, r2 = 0.2022 and two-tailed P = 0.0164. e Correlations between the PET feature PUVmaxn (maximum standard uptake value) and the MRI features (MRI-contrast-enhanced gut wall thickness), n = 13, r = −0.8205, 95% CI = −0.9445–0492, r2 = 0.6733 and two- tailed P = 0.0006. Temporal development of the colitis-like phenotype in M. sexta at baseline conditions and after Bt treatment after 3 h, 12 h, and 24 h or 36 h in f PET, n = 63, one-way ANOVA, F(3,59) = 6.064, R2 = 0.2357, P = 0.0011, box plots: 25th–75th percentiles, whiskers: min–max (show all points), center: median, g and i CT, n = 56, Kruskal-Wallis test = 32.54, P < 0.0001 and n = 38, one-way ANOVA, F(2,35) = 35.66, R2 = 0.6708, P < 0.0001, and h, j, and l MRI, n = 78, one-way ANOVA, F(2,75) = 46.52, R2 = 0.5537, P < 0.0001, n = 51, Kruskal-Wallis test = 38.45, P < 0.0001 and n = 49, Kruskal-Wallis test = 17.36, P = 0.0002. The following significance levels have been used: ns = P > 0.05, * = P ≤ 0.05, ** P ≤ 0.01, *** = P ≤ 0.001 and **** = P ≤ 0.0001. The dashed lines in the diagrams illustrate the respective threshold values received from the ROC analysis. Error bars represent standard deviation. Bar charts represent mean and SD. Every data point represents a single animal. Source data are provided as a Source Data file.

